
Figure 2.
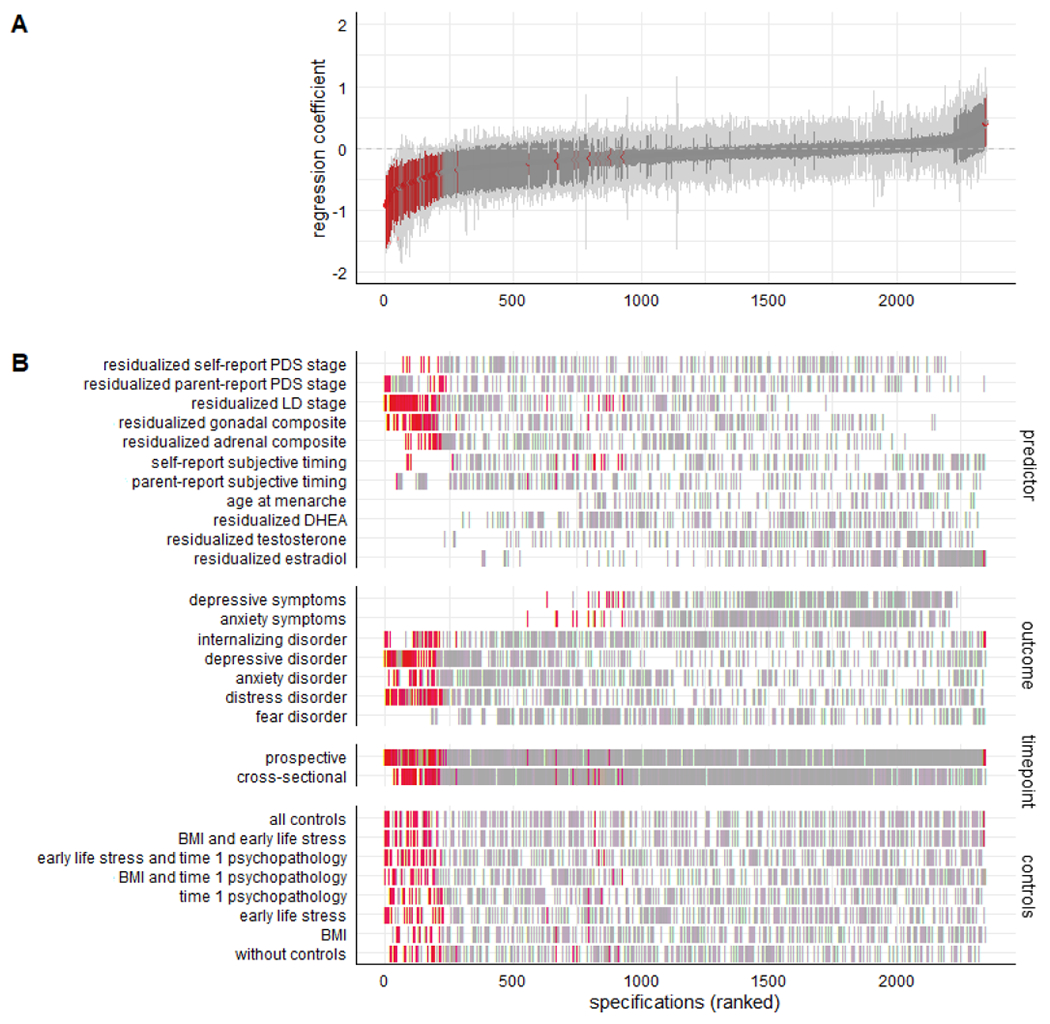
A) Specification curve for the association between pubertal timing and internalizing psychopathology. Each dot represents one specification, with red coloured dots representing significant models (p<.05). The red area around each dot is the bootstrapped 95% confidence interval. Specifications are ranked by their regression coefficient. All models were run with standardized data. B) Specifications sorted by predictor, outcome, time point of the predictor, and combination of control variables. Note that residual-based variables have been multiplied by −1 so that for all pubertal timing variables higher values indicate later timing.