. 2022 Aug 12;11:e77848. doi: 10.7554/eLife.77848

Figure 1. Stag2 ablation in the mouse nervous system causes growth retardation and neurological defects.

(A) Scheme for creating the ‘floxed’ Stag2 allele by gene targeting. The genomic structure of the wild-type (WT) Stag2 locus, the targeting vector, the knockin allele, the disrupted allele after Cre-mediated recombination, and the positions of the genotyping primers are shown. The amino acid sequence of the knockout allele in the targeted region is shown and aligned with that of the WT allele. (B) PCR analysis of the genomic DNA extracted from the tails of indicated mice with the primers in (A). (C) PCR analysis of genomic DNA extracted from brains (B) or livers (L) of indicated mice. (D) Immunoblots of brain lysates of Stag2f/y and Stag2f/y;NesCre mice with antibodies recognizing cohesin subunits and TUBULIN (as the loading control). (E) Representative images of Stag2f/y and Stag2f/y;NesCre mice. Scale bar = 2 cm. (F) Body weight of Stag2f/y and Stag2f/y;NesCre mice at different age. Mean ± standard deviation (SD) of at least three mice of the same age. (G) Survival curves of Stag2f/y (n = 12) and Stag2f/y;NesCre (n = 21) mice. Food (H) and water (I) consumption of 7- to 8-week-old Stag2f/y (n = 6) and Stag2f/y;NesCre (n = 4) mice. Mean ± SD; ns, not significant. (J) Plasma IGF-1 levels of 2-month-old Stag2f/y (n = 5) and Stag2f/y;NesCre (n = 6) mice. Mean ± SD; ****p < 0.0001. (K) Representative images of limb-clasping responses of Stag2f/y and Stag2f/y;NesCre mice. The uncropped images of blots in (B–D) are included in Figure 1—source data 1.

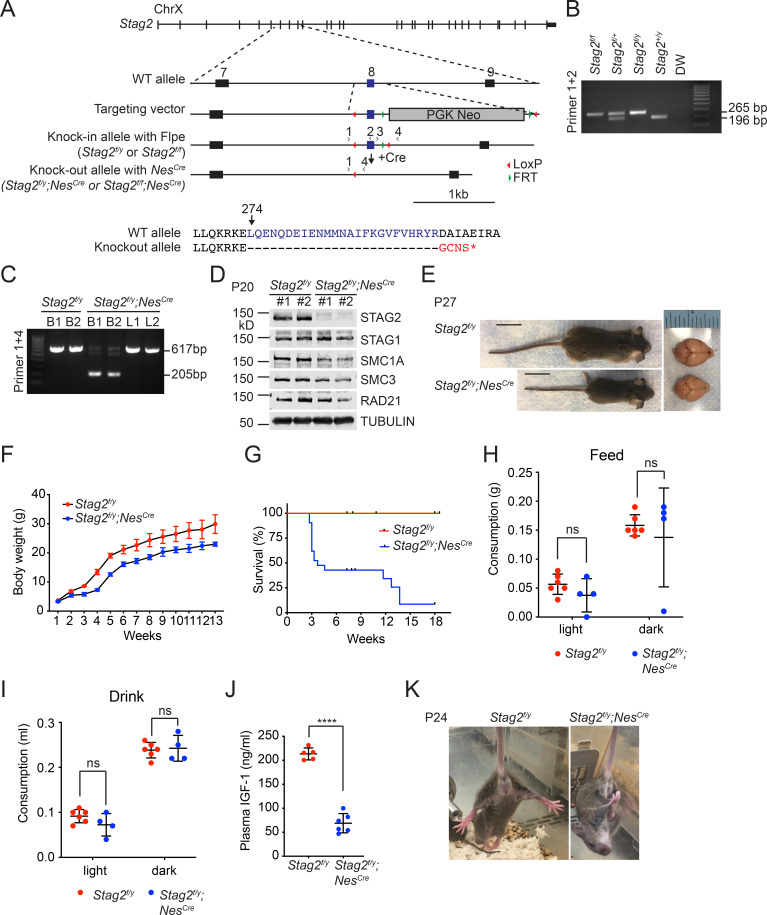
Figure 1—source data 1. Uncropped images of gels and blots in Figure 1.

Figure 1.

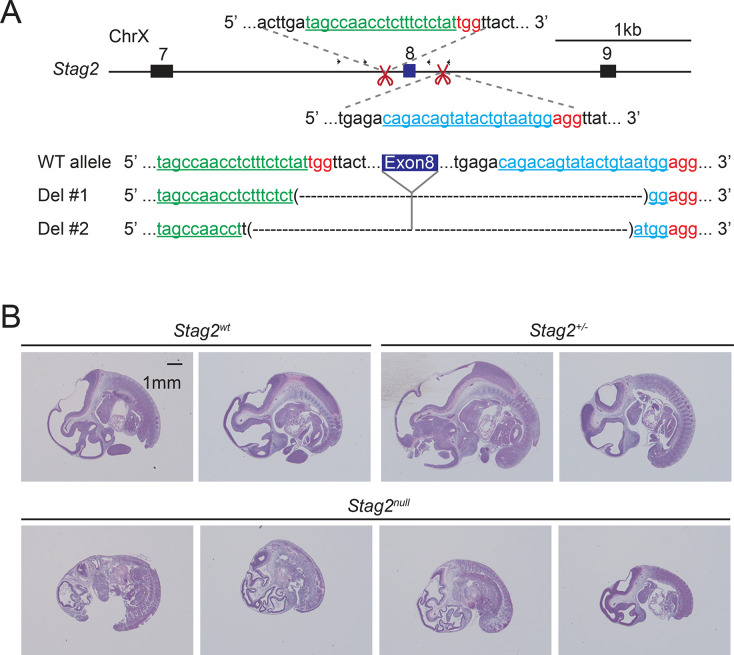
Figure 1—figure supplement 1. Generation of Stag2 knockout mice using the CRISPR/Cas9 method.

Figure 1—figure supplement 1.

(A) Scheme for disrupting Stag2 in the mouse genome using CRISPR/Cas9 with guide RNAs flanking exon 8. Sequencing analysis of the genomic DNA extracted from two Stag2-disrupted founder mice is shown below. (B) Hematoxylin and eosin (H&E) staining of sagittal sections of F2 embryos derived from F1 in (A) at E11.5.
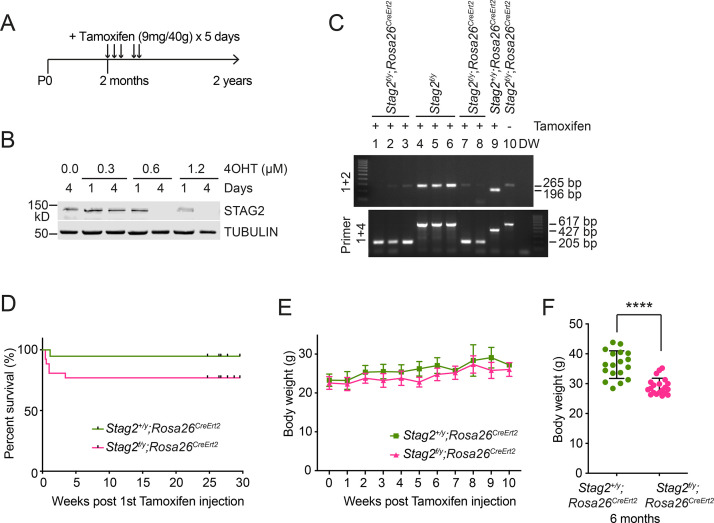
Figure 1—figure supplement 2. Generation of Stag2 conditional knockout mice by gene targeting.

Figure 1—figure supplement 2.

(A) Experimental scheme of tamoxifen injection into adult Stag2f/y;Rosa26CreErt2 and Stag+/y;Rosa26CreErt2 mice. (B) Western blotting of cell extracts from Stag2f/y;Rosa26CreErt2 mouse embryonic fibroblasts (MEFs) treated with or without 4-hydroxytamoxifen (4OHT). E12.5 MEFs were prepared from Stag2f/y;Rosa26CreErt2 mouse embryos and subjected to 4OHT treatment. (C) PCR analysis of the genomic DNA extracted from the blood of indicated mice with the primers in Figure 1A. Only the floxed mice carrying Rosa26CreErt2 (1,2,3,7,8) had their exon 8 excised in the condition of tamoxifen injection. (D) Survival curves of Stag2f/y;Rosa26CreErt2 (n = 26) and Stag+/y;Rosa26CreErt2 (n = 19) mice after tamoxifen injection. (E) Body weight of mice in (D). (F) Body weight of Stag2f/y;Rosa26CreErt2 (n = 20) and Stag+/y;Rosa26CreErt2 (n = 18) mice at 6 months post tamoxifen injection. ****p < 0.0001. Uncropped images of gels and blots in this figure are included in Figure 1—figure supplement 2—source data 1.
Figure 1—figure supplement 2—source data 1. Uncropped images of gels and blots in Figure 1—figure supplement 2.