. 2022 Aug 12;11:e77848. doi: 10.7554/eLife.77848

Figure 2. Stag2 ablation in mouse brains downregulates the expression of myelin genes.

(A) Volcano plot of bulk RNA-sequencing results of Stag2f/y and Stag2f/y;NesCre brain extracts. Top differentially expressed genes (DEGs) are colored blue and labeled. n = 4 pairs of P21 Stag2f/y and Stag2f/y;NesCre brain hemispheres were used for the comparison. (B) Reverse transcription quantitative PCR (RT-qPCR) analysis of the top downregulated genes in the brain extracts. n = 4 pairs of Stag2f/y and Stag2f/y;NesCre littermates were used. Mean ± standard deviation (SD). (C) Heatmap of the expression of myelin-enriched genes that were downregulated by more than twofolds in Stag2f/y;NesCre brains. L1 and R1, left and right brain hemispheres of the Stag2f/y#1 mouse. L2 and R2, left and right brain hemispheres of the Stag2f/y#2 mouse. L1’ and R1’, left and right brain hemispheres of the Stag2f/y;NesCre #1 mouse. L2’ and R2’, left and right brain hemispheres of the Stag2f/y;NesCre#2 mouse. The biological pathways of these genes are labeled on the right. (D) The top 5 canonical pathways identified by ingenuity pathway analysis (IPA) of the DEGs. The complete gene list is used as the background.

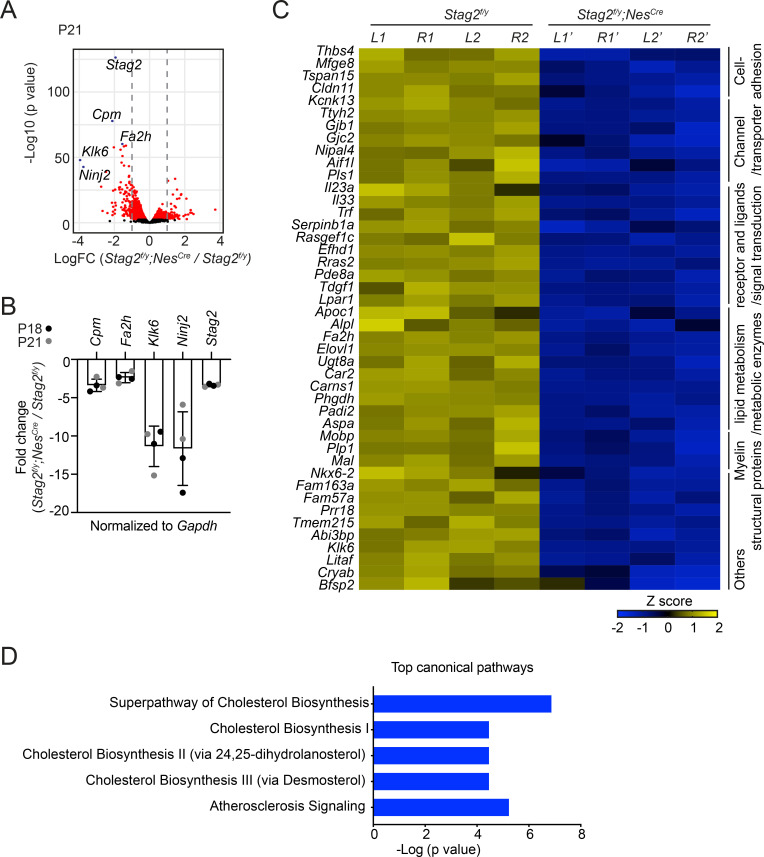
Figure 2.

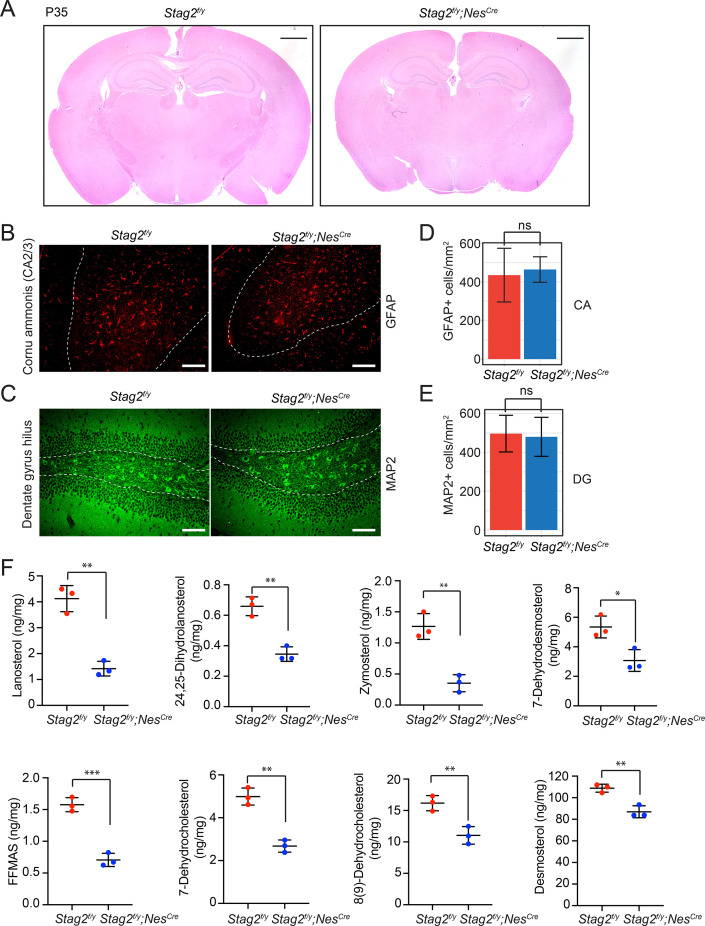
Figure 2—figure supplement 1. STAG2 deficiency in mouse brains attenuates cholesterol biosynthesis.

Figure 2—figure supplement 1.

(A) Hematoxylin and eosin (H&E) staining of the coronal sections of Stag2f/y and Stag2f/y;NesCre mouse brains. Scale bar = 1 mm. Immunohistochemistry staining of signature proteins of astrocytes (B) and neurons (C) on brain coronal sections of P18 or P21 Stag2f/y and Stag2f/y;NesCre mice. Scale bar = 100 μm. (D) Density of GFAP+ astrocytes in the cornu ammonis (CA) area (outlined with white dash lines in B) of the hippocampus. n = 3 mice per genotype. Mean ± SD; ns, not significant. (E) Density of MAP2+ neurons in the dentate gyrus hilus (outlined with white dash lines in C). n = 3 mice for Stag2f/y and n = 4 mice for Stag2f/y;NesCre. Mean ± SD; ns, not significant. (F) Mass spectrometry analysis of cholesterol precursors in Stag2f/y and Stag2f/y;NesCre brains. The cholesterol precursors mass measurement was normalized to the brain weight. n = 3 mice per genotype. *p < 0.05, **p < 0.01, ***p < 0.001; mean ± standard deviation (SD).
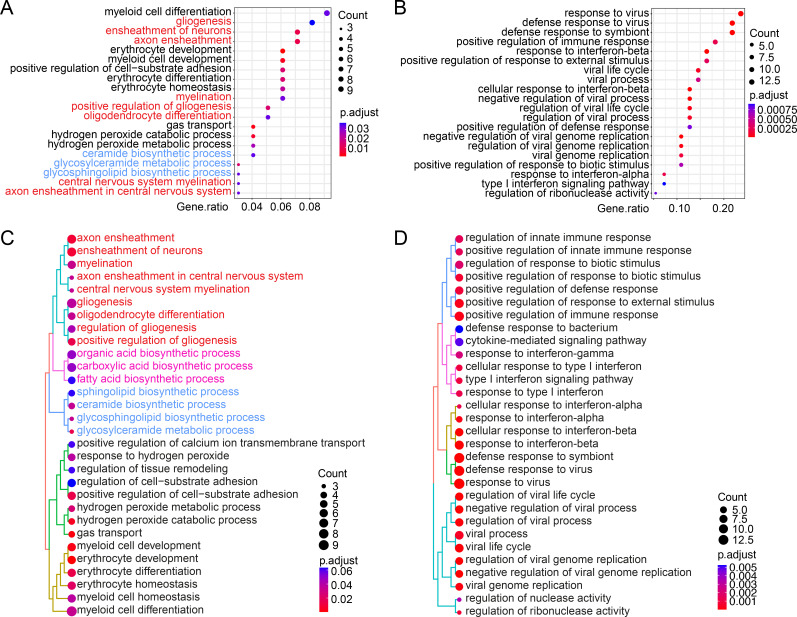
Figure 2—figure supplement 2. Over-representation analysis (ORA) of the RNA-sequencing (RNA-seq) results of the mouse brain samples.

Figure 2—figure supplement 2.

The enriched biological pathways identified by gene ontology of ClusterProfiler from the downregulated genes (A) or upregulated genes (B) with >twofold change between Stag2f/y and Stag2f/y;NesCre mice from the whole-brain RNA-seq dataset. Pathways of gliogenesis and myelination are highlighted in red. Pathways of membrane lipid biosynthesis are colored in blue. The top 20 pathways with the highest gene ratio are presented. Similarity tree plot of the top 30 enriched biological pathway as identified in A for the downregulated genes (C) or as in (B) for the upregulated genes (D). Pathways of myelination and gliogenesis are highlighted in red. Pathways of fatty acid biosynthesis and membrane lipid biosynthesis related to myelin sheath formation are colored in pink and blue, respectively.