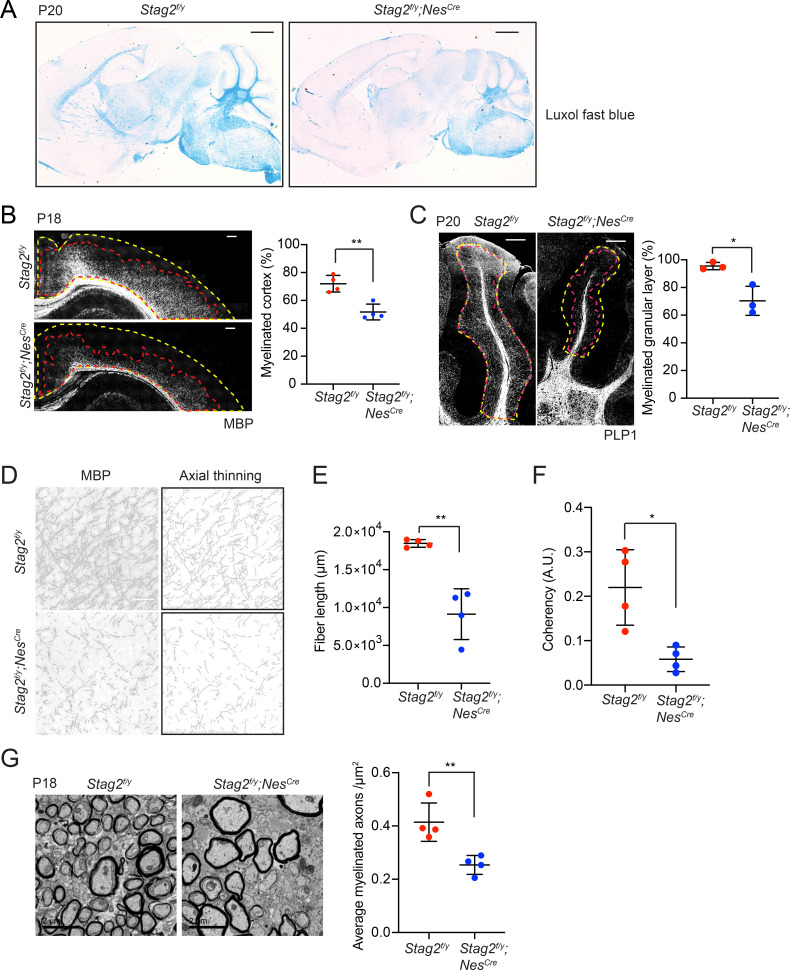
Figure 3. Stag2 ablation in the nervous system compromises myelination during early postnatal development.
(A) Luxol fast blue staining of the sagittal sections of Stag2f/y and Stag2f/y;NesCre brains. n = 3 animals per genotype. Scale bar = 1 mm. (B) Immunohistochemistry staining with the anti-MBP antibody in the cerebral cortex (left panel). Antibody-stained areas and DAPI staining regions are marked with red and yellow dashed lines, respectively. Scale bar = 200 μm. Quantification of the percentage of the myelinated cortex is shown in the right panel. n = 4 pairs of Stag2f/y and Stag2f/y;NesCre littermates were used (P18 or P21) for the comparison. **p < 0.01; mean ± standard deviation (SD). (C) Immunohistochemistry staining with the anti-PLP1 antibody in the cerebellum (left panel). Antibody-stained areas and DAPI staining regions are marked with red and yellow dashed lines, respectively. Scale bar = 200 μm. Quantification of the percentage of the myelinated cerebellum granular layer is shown in the right panel. n = 3 pairs of Stag2f/y and Stag2f/y;NesCre littermates were used (P20 or P25) for the comparison. *p < 0.05; mean ± SD. (D) Higher magnification images (left panel) of the immunohistochemistry staining with the anti-MBP antibody in (B). Images processed through axial thinning are shown in the right panel. Scale bar = 50 μm. Total fiber length (E) and fiber coherency (F) measured using the processed images in (D). n = 4 pairs of Stag2f/y and Stag2f/y;NesCre littermates were used (P18 or P21). *p < 0.05, **p < 0.01; mean ± SD. (G) Transmission electron microscopy images of the optic nerves (left panel). Scale bar = 2 μm. Quantification of myelinated axon distributions is shown in the right panel. n = 4 pairs of P18 Stag2f/y and Stag2f/y;NesCre littermates were used. n ≥ 10 fields of each mouse were taken, and the average distribution of myelinated axons were calculated for each mouse and plotted. **p < 0.01; mean ± SD.


