. 2022 Aug 12;11:e77848. doi: 10.7554/eLife.77848

Figure 4. Deletion of Stag2 in mouse brains causes differentiation delay and transcriptional changes in oligodendrocytes.

(A) t-SNE plot of cell clusters in Stag2f/y and Stag2f/y;NesCre forebrains analyzed by single-cell RNA-sequencing (scRNA-seq). n = 2 mice of each genotype were used in the scRNA-seq analysis. aNSCs/NPCs, active neural stem cells or neural progenitor cells; Astrocytes/qNSCs, astrocytes or quiescent neural stem cells; OPCcycs, cycling oligodendrocyte (OL) progenitor cells; OPCs, OL progenitor cells; NFOLs, newly formed OLs; mFOLs, myelin-forming OLs; MOLs, matured OLs; VLMCs, vascular and leptomeningeal cells; vSMCs, vascular smooth muscle cells. (B) t-SNE clustering as in (A) but colored by genotype. (C) Left panel: cell-type composition and percentage as colored in (A). Right panel: percentage of cell clusters of the oligodendrocyte lineage. (D) FeaturePlot of a representative gene (Mal) specifically suppressed in MOLs of Stag2f/y;NesCre forebrains. A maximum cutoff of 3 was used. (E) Experimental scheme of the magnetic-activated cell sorting (MACS) of primary OLs. (F) Volcano plot of bulk RNA-sequencing (RNA-seq) results of Stag2f/y and Stag2f/y;NesCre primary OLs. (G) The top 5 canonical pathways identified by ingenuity pathway analysis (IPA) of the differentially expressed genes (DEGs) with more than twofold change in (F). The complete gene list is used as the background. (H) Commons DEGs shared between bulk RNA-seq analyses of the whole brains (WB) and primary OLs.

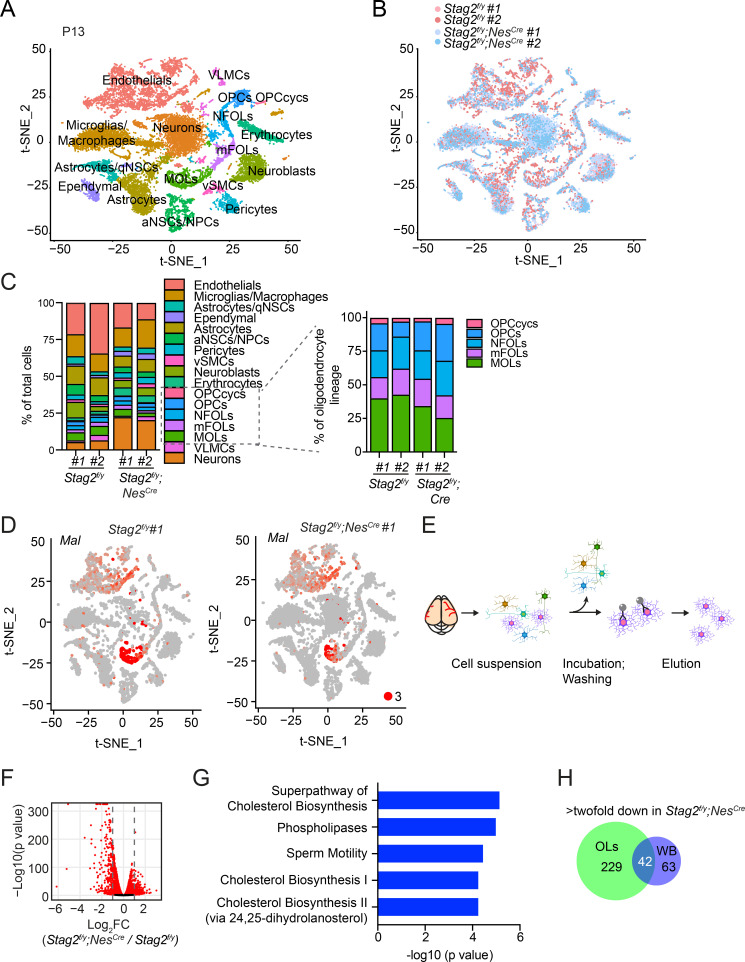
Figure 4.

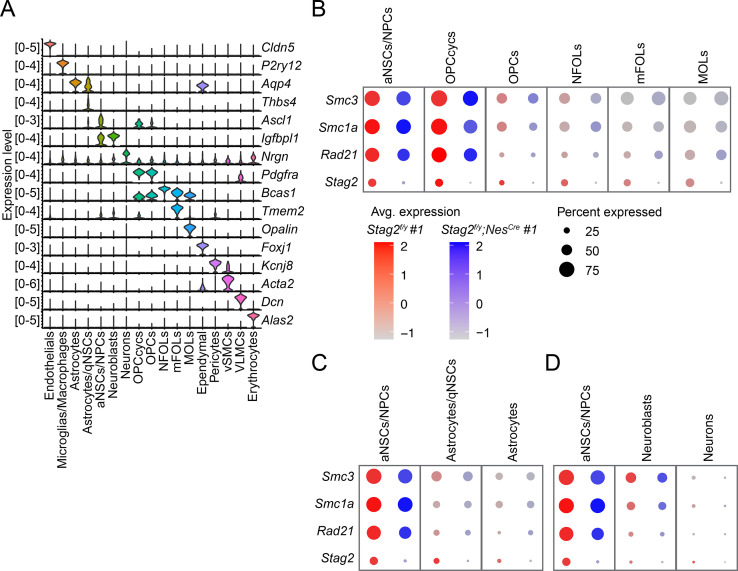
Figure 4—figure supplement 1. Stag2 is ablated during early neural lineage differentiation of Stag2 knockout mice.

Figure 4—figure supplement 1.

(A) Violin plot of the expression levels of feature genes of the indicated brain cell types. Dotplot showing the expression levels of cohesin subunit genes in the oligodendrocyte lineages (OLs; B), astrocytes (C), and neurons (D) and in the progenitor cells. Stag2 expression is greatly diminished in the neuronal stem cells (NSCs) or neuronal progenitor cells (NPCs).
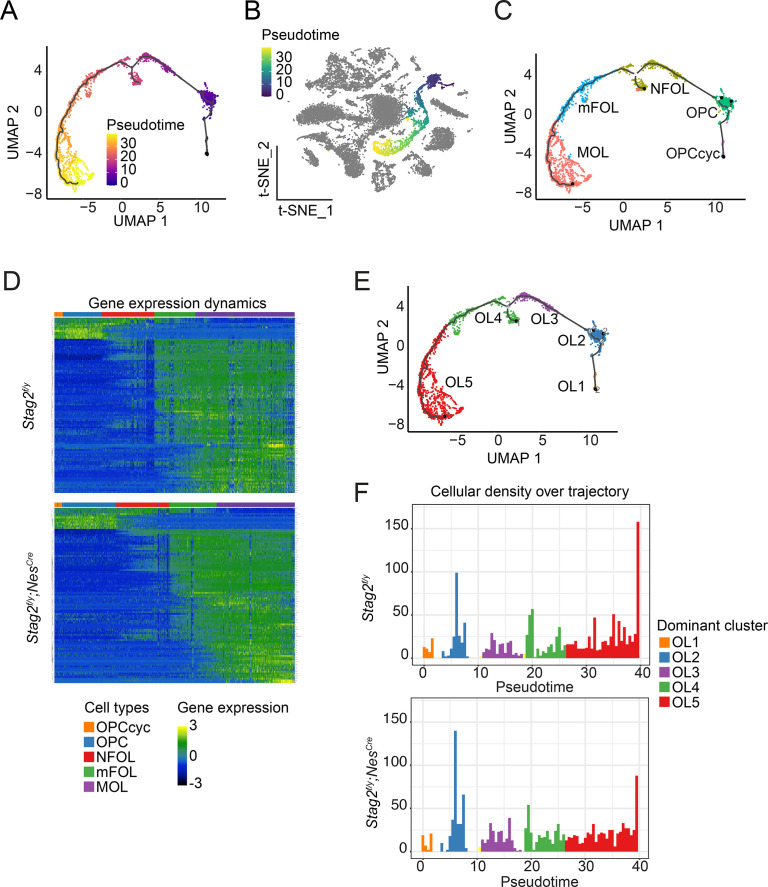
Figure 4—figure supplement 2. Stag2 deletion causes differentiation delay in the oligodendrocyte lineage.

Figure 4—figure supplement 2.

(A) Trajectory inference analysis of oligodendrocyte (OL) lineage cells extracted from the single-cell RNA-sequencing (RNA-seq) dataset using Monocle3. Cells are colored from purple to yellow by pseudotime variables. (B) OL differentiation trajectory in the t-SNE plot. The OL lineage is colored from navy blue to yellow by pseudotime variables. Cells of other lineages are colored grey. (C) Distribution of the assigned OL cell types along the trajectory. (D) Heatmap of gene expression dynamics over pseudotime along the OL differentiation trajectory. Each row represents one of the top 100 most variable genes along pseudotime. Each column represents a single cell. (E) Reclustered OL subgroups in the trajectory inference analysis. (F) Cell density across pseudotime for the OL differentiation trajectory. Dominant clusters for each pseudotime bin are color labeled as in (E).
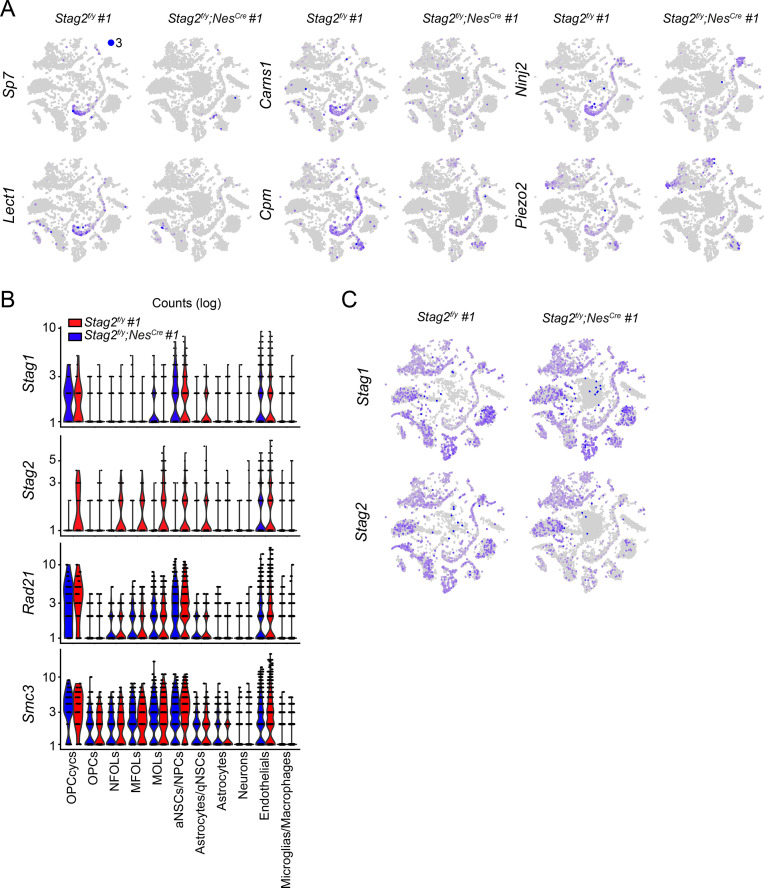
Figure 4—figure supplement 3. STAG2 regulates the transcription of oligodendrocyte genes.

Figure 4—figure supplement 3.

(A) FeaturePlot of the expression levels of representative downregulated genes in the Stag2f/y;NesCre whole brains. Maximum cutoff of 3 was used. (B) Violin plot of the expression of cohesin subunit genes in the indicated brain cell types from the single-cell RNA-sequencing (scRNA-seq) transcriptome analysis. (C) FeaturePlot of the expression of Stag1 and Stag2 in Stag2f/y and Stag2f/y;NesCre forebrains. Maximum cutoff of 3 was used.
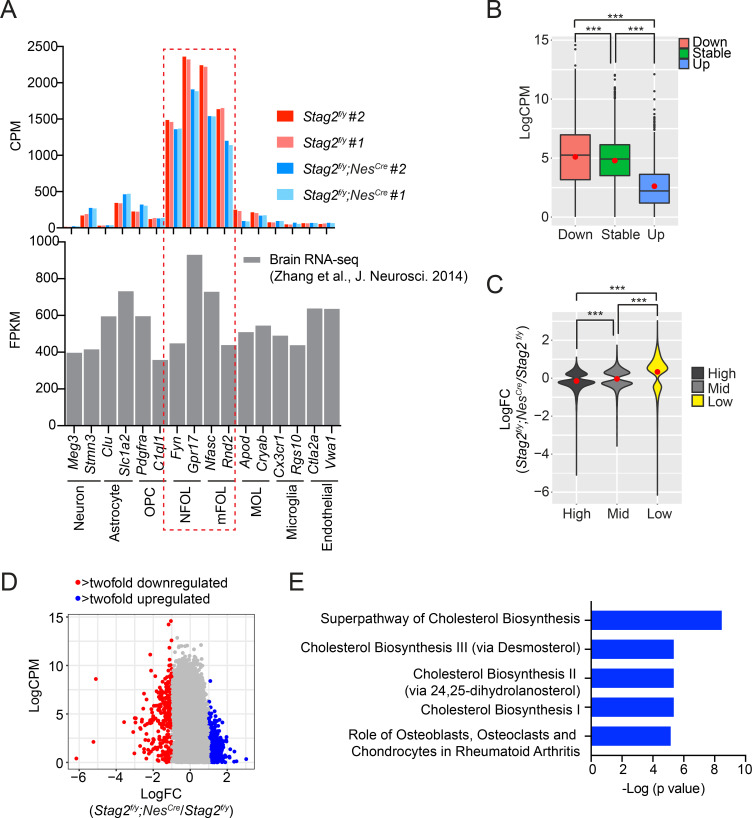
Figure 4—figure supplement 4. STAG2 regulates transcription in primary oligodendrocytes.

Figure 4—figure supplement 4.

(A) The expression levels of signature genes of indicated brain cell types in the isolated primary oligodendrocytes (OLs) in this study. The expression levels of the same set of signature genes in the individually isolated cell types from previous studies are shown below. NFOL and mFOL signature genes are highly enriched in the isolated primary OLs in this study. (B) Boxplot of the expression levels for genes in the indicated categories. Red dots represent the mean values. ***p < 0.001. Differentially expressed genes (DEGs) with more than 1.5-fold change are assigned as ‘down’ or ‘up’. Active genes with logFC between ±0.38 are assigned ‘stable’. (C) Violin plot of the expression changes for the active genes with different expression levels. Red dots represent the mean value. ***p < 0.001. (D) Scatter plot of the gene expression level against transcriptional changes. DEGs of the indicated categories are highlighted in red and blue.(E) Ingenuity pathway analysis (IPA) of the downregulated gene sets. The top 5 canonical pathways identified from IPA analysis of the downregulated genes in Stag2-deleted OLs. Downregulated genes with >twofold change were included in the analysis.
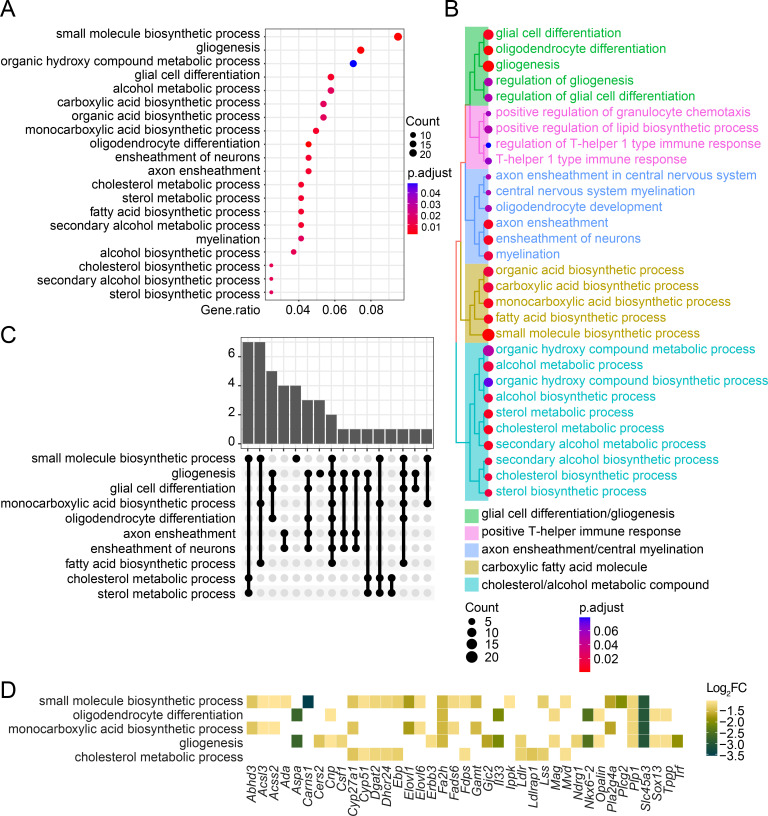
Figure 4—figure supplement 5. Over-representation analysis (ORA) of the downregulated genes in Stag2-deleted oligodendrocytes.

Figure 4—figure supplement 5.

(A) The enriched biological pathways identified from the downregulated genes with >twofold change in the Stag2-deleted primary oligodendrocytes. The top 20 pathways with the highest gene ratio are presented. (B) Treeplot of the top 30 enriched biological pathways identified as in (A). Pathways are grouped and colored by similarity. (C) Overlapped genes among the enriched biological pathways. Bar graph shows the number of overlapped genes among biological pathways. (D) Heatmap of the top enriched biological pathways and the expression change of related genes.
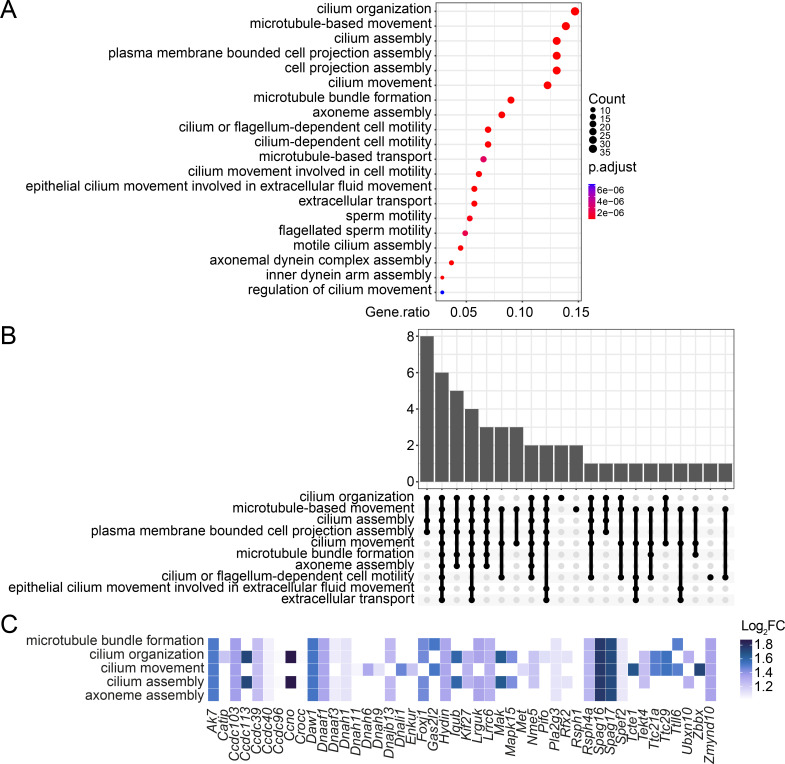
Figure 4—figure supplement 6. Over-representation analysis (ORA) of the upregulated genes in Stag2-deleted oligodendrocytes.

Figure 4—figure supplement 6.

(A) The enriched biological pathways identified from the upregulated genes with >twofold change in the Stag2-depleted primary oligodendrocytes. The top 20 pathways with the highest gene ratio are presented. (B) Overlapped genes among the enriched biological pathways. Bar graph shows the number of overlapped genes among biological pathways. (C) Heatmap of the top enriched biological pathways and the expression change of related genes.