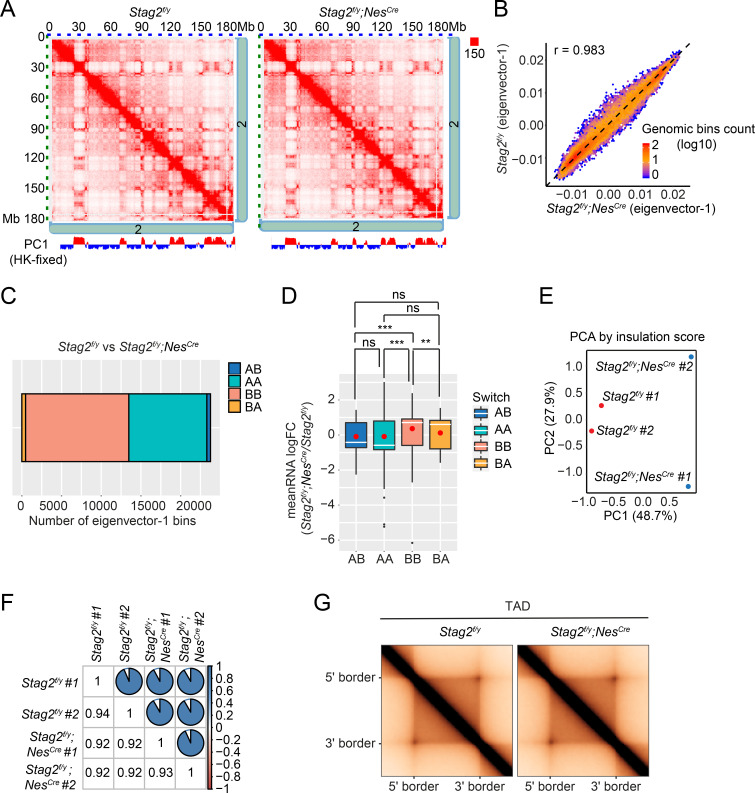
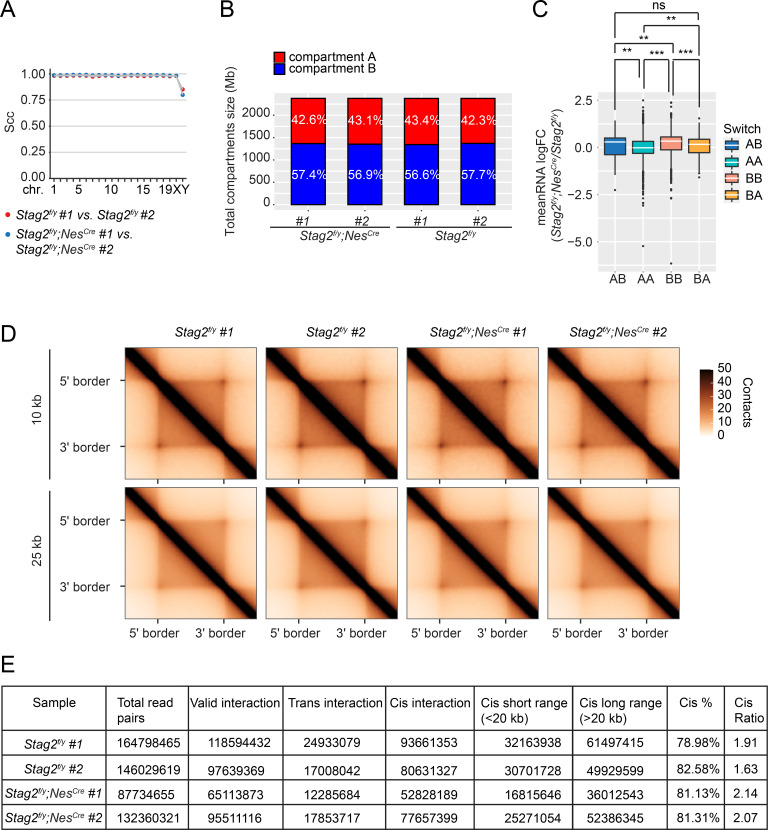
Figure 6. Loss of Stag2 does not alter compartments and topologically associated domains (TADs) in oligodendrocytes.
(A) Representative snapshots of balanced Hi-C contact matrices of chromosome 2. Tracks of eigenvector-1 fixed with housekeeping genes are shown below, with A and B compartments shown in red and blue, respectively. (B) Hexbin plot of eigenvector-1 for genomic bins (100 kb) in Stag2f/y and Stag2f/y;NesCre oligodendrocytes (OLs). (C) Chromatin bins were classified into four categories based on the eigenvector sign and whether it has switched with a delta bigger than 1.5. AB, changing from compartment A in Stag2f/y to compartment B in Stag2f/y;NesCre; BA, from B in Stag2f/y to A in Stag2f/y;NesCre; AA, A in both Stag2f/y and Stag2f/y;NesCre; BB, B in both Stag2f/y and Stag2f/y;NesCre. (D) Boxplot of averaged gene expression change of differentially expressed genes (DEGs) (RNA logFC cutoff of ±0.58) inside each genomic bin. Bins counted: AA, 1646; AB, 56; BA, 69; BB, 910. Red dots represent the mean value. An unpaired Wilcoxon test was used for the statistical analysis. **p < 0.01; ***p < 0.001; ns, not significant. Principal component (E) and similarity (F) analysis performed using the insulation score at 10 kb resolution. (G) Aggregate TAD analysis on the 10 kb merged Hi-C matrices using TADs called from the merged samples of Stag2f/y at 10 kb resolution.


