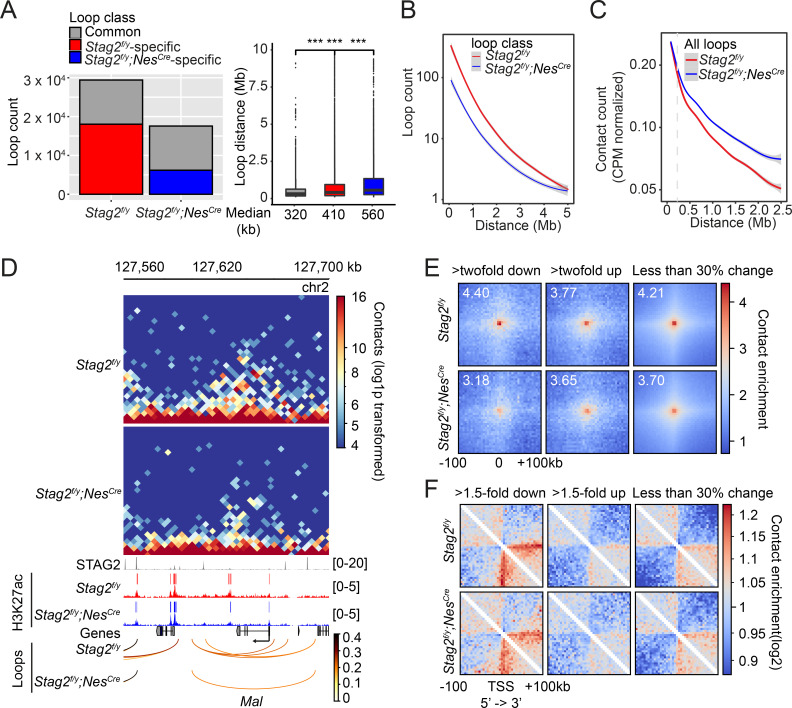
Figure 7. Stag2 deletion impairs the formation of total and promoter-anchored loops in oligodendrocytes.
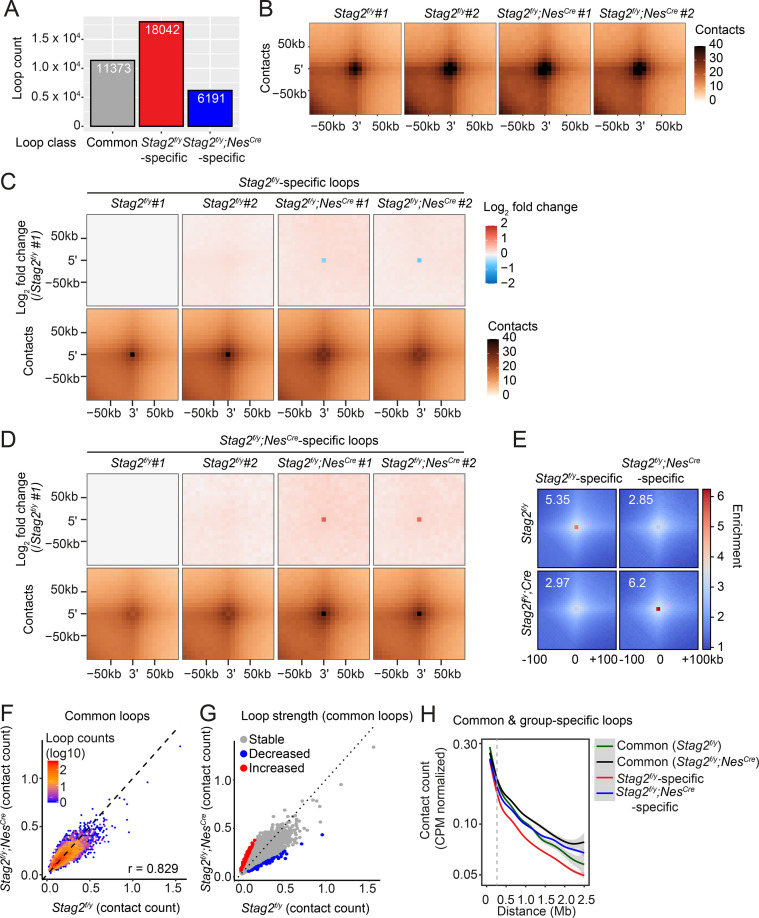
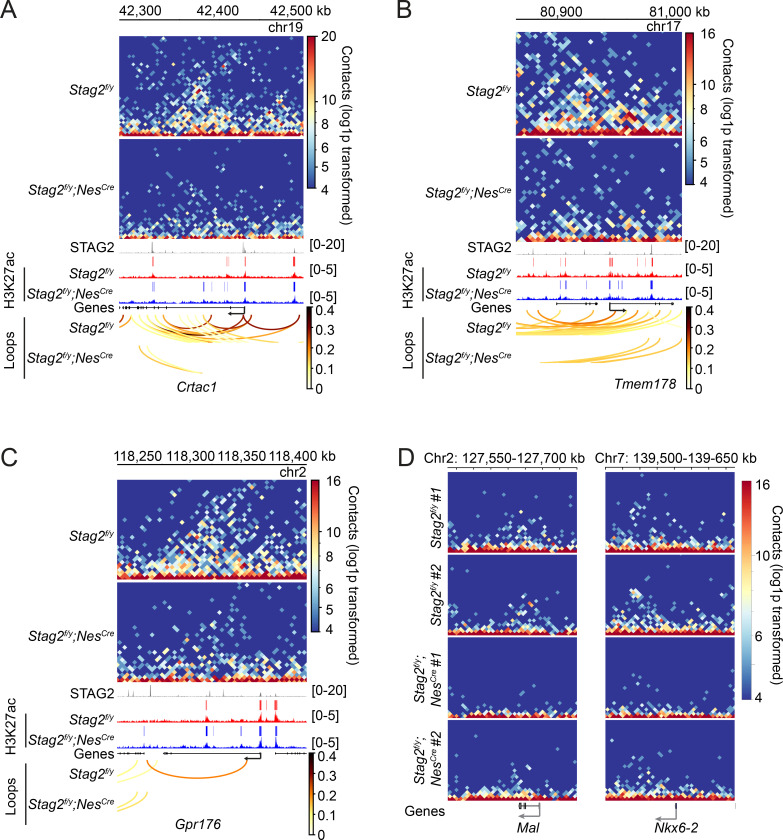
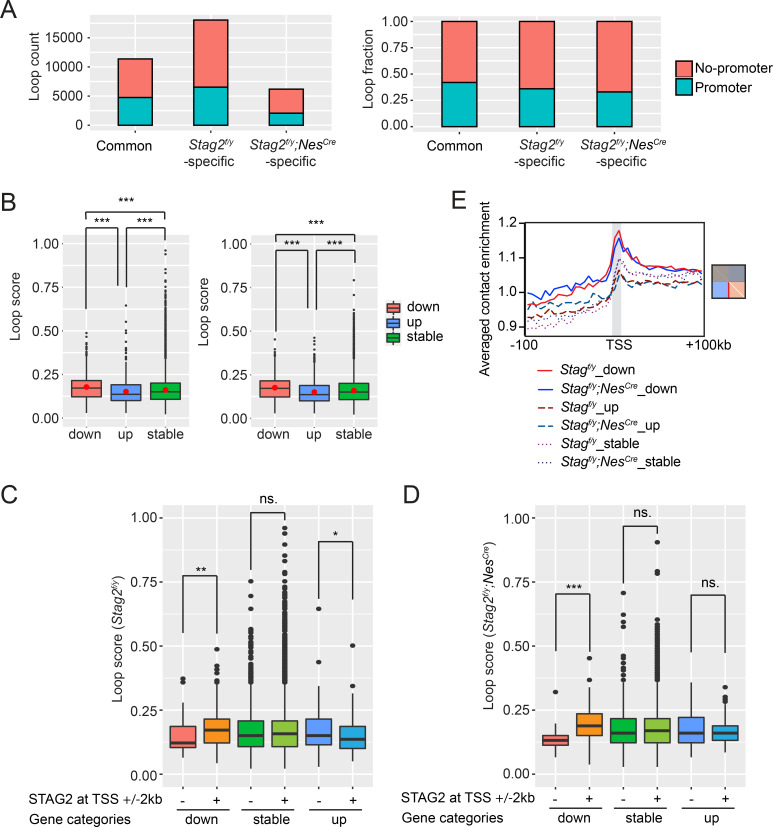
(A) Loop counts (left panel) and length (right panel) in the indicated categories of Stag2f/y and Stag2f/y;NesCre oligodendrocytes (OLs). ***p < 0.001. (B) Loop counts plotted against loop length (from 0 to 5 Mb) of Stag2f/y and Stag2f/y;NesCre OLs. (C) Normalized contact counts for loops across different genomic distances in Stag2f/y and Stag2f/y;NesCre OLs. (D) Representative snapshots of contact maps at the Mal gene locus.hic files generated by HiC-Pro were converted to.cool format for plotting at 5 kb resolution. Tracks and narrow peaks from STAG2 and H3K27ac chromatin immunoprecipitation sequencing (ChIP-seq) as well as the loops are plotted below. Transcription direction is indicated by the black arrow. (E) Pile-up analysis of loop ‘dots’-centered local maps for the promoter-anchored loops of genes in the indicated categories. The maps are balanced, normalized by distance, and plotted at 5 kb resolution. The numbers indicate the enrichment of the central pixel over the upper left and bottom right corners. (F) Pile-up analysis of the local contact maps centered around the transcription start site (TSS) of genes in the indicated categories. Transcription directions are indicated below. 1000 stable genes are chosen randomly and used for the analysis. The maps are balanced, normalized by distance, and plotted at 5 kb resolution. Diagonal pixels are omitted.


