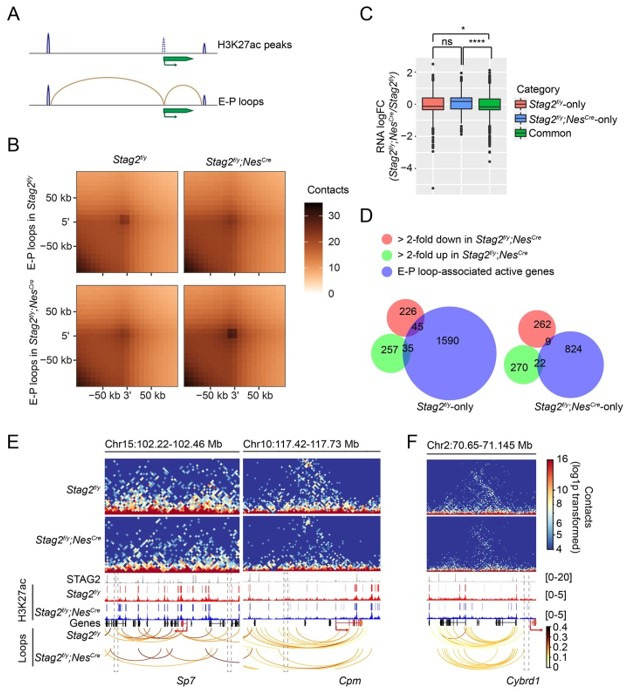
Author response image 1. Enhancer-promoter loops and E-P loop-anchored gene expression change.

(A) Scheme for identifying enhancer-promoter (E-P) loops. H3K27ac peaks at gene TSS ±2kb region are removed. E-P loops are anchored to promoters on one end and to the remaining H3K27ac peaks on the other end. (B) Aggregate peak analysis of E-P loops identified from Stag2f/y or Stag2f/y;NesCre OLs on the 10 kb Hi-C matrices using GENOVA. (C) Boxplot of the expression levels for genes in the indicated categories. Stag2f/y, genes only anchored to E-P loops in Stag2f/y cells; Stag2f/y;NesCre, genes only anchored to E-P loops in Stag2f/y;NesCre cells; Common, genes anchored to E-P loops in both Stag2f/y and Stag2f/y;NesCre cells. Significant active genes with FDR<0.05 were included in the analysis. Unpaired Wilcoxon test was used for the statistical analysis. **p < 0.01, ****p < 0.0001, ns, not significant. (D) Venn diagram showing the comparison of down-regulated gene list, up-regulated gene list in Stag2f/y;NesCre OLs, and the EP loop-anchored active gene lists specific to Stag2f/y or Stag2f/y;NesCre OLs, respectively. Gene counts are shown. (E) Snapshots of the contact maps of genomic locus of repressed genes with lost E-P loops and H3K27ac peaks in the Stag2f/y;NesCre cells. Tracks and narrow peaks from STAG2 and H3K27ac ChIP-seq as well as the loops are plotted below. Genes of interest are highlighted in red. The transcription directions are indicated by the arrows. Lost loop anchors and H3K27ac peaks are framed with grey dashed lines. (F) A snapshot of the contact maps of genomic locus of an activated gene Cybrd1 with gained E-P loop in the Stag2f/y;NesCre cells. Tracks and narrow peaks from STAG2 and H3K27ac ChIP-seq as well as the loops are plotted below. The Cybrd1 gene body and TSS are highlighted in red. The gained loop anchor is framed with grey dashed lines.
