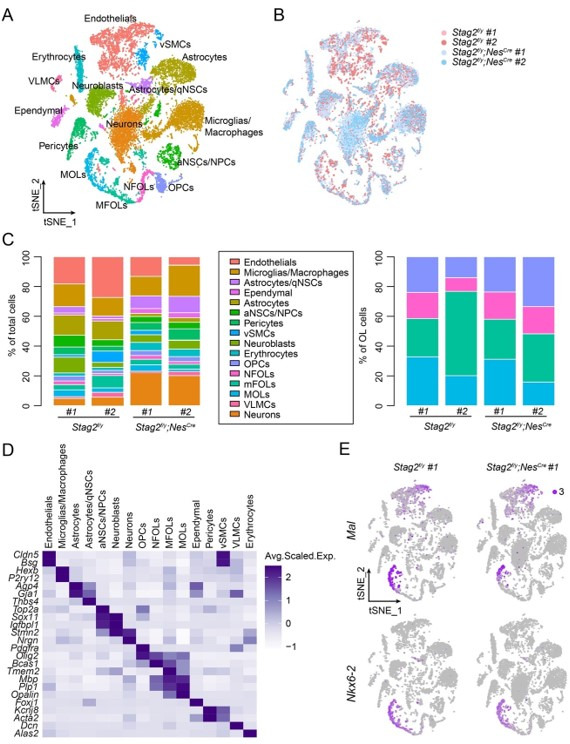
Author response image 2. Transcriptome analysis of Stag2-depleted forebrains.

(A) t-SNE plot of cell clusters with the filtering criteria of nFeature_RNA (200-6500) in the single-cell analysis by Seurat. (B) t-SNE clustering as in (A) but colored by genotype. (C) Left panel: cell type composition and percentage as colored in (A). Right panel: percentage of cell clusters of the oligodendrocyte lineage. (D) Heatmap showing the expression levels of cell-type signature genes. (E) FeaturePlot of the representative genes (Mal and Nkx6-2) specifically suppressed in the late stages of OLs in Stag2-depleted forebrains. A maximum cutoff of 3 was used.
