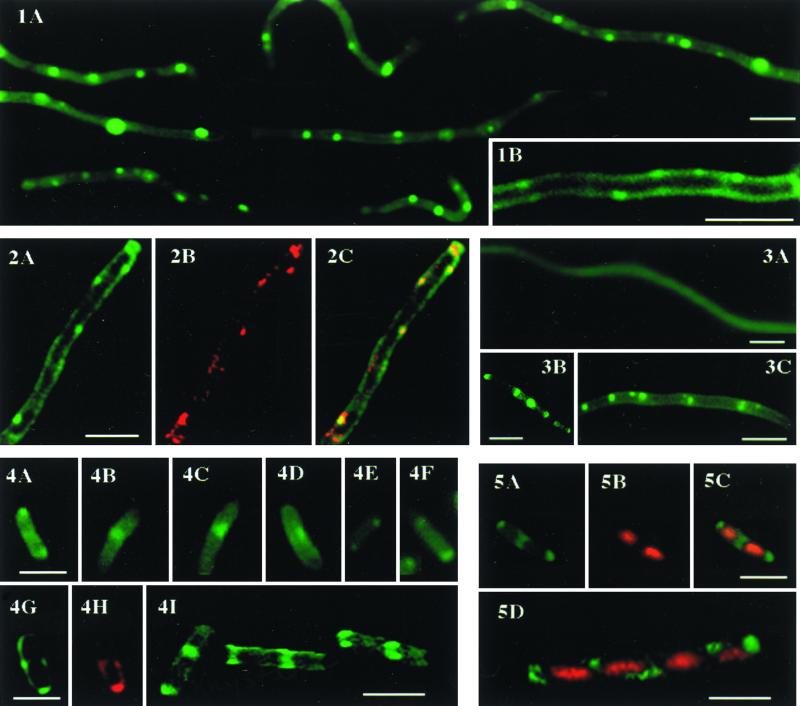
FIG. 1-5.
Fig. 1. Staining of living AD90 filamentous cells with NAO. Cells were grown in LB medium supplemented with 50 mM MgCl2. (A) NAO was added to the cells in the exponential phase of growth, and pictures were taken after 1 h of incubation with the dye. (B) A part of filamentous AD90 cell at a higher magnification is shown. Bars, 2.5 μM. Exposure time, 0.25 s. Fig. 2. Deconvoluted images of an optical section of an AD90 cell. Cells were stained as described in the legend to Fig. 1. (A and B) Excitation was at 490 nm, and emission was at either 528 (A) or 617 (B) nm. Bar, 2.5 μM. Exposure time, 0.5 s. (C) Colocalization of green and red fluorescent domains. Fig. 3. Staining of living ADC/pDD72 (A), HDL11 (B), and E614 (C) cells with NAO. Cells were grown in LB medium supplemented with cephalexin and stained with NAO. Bars, 2.5 μM. Exposure times, 2 (A) and 1 (B and C) s. Fig. 4. Staining of living AD90/pDD72 cells with NAO. (A to F) Individual AD90/pDD72 cells. (G and H) Deconvoluted images of an optical section of an AD90/pDD72 cell. Excitation was at 490 nm and emission was at either 528 (G) or 617 (H) nm. (I) Three-dimensional picture of an AD90/pDD72 cell stained with NAO obtained by reconstruction of deconvolved optical sections. The same cell is shown at three different angles of rotation. Bars, 2.5 μM. Exposure time, 1 s. Fig. 5. AD90/pDD72 (A to C) and AD90 (D) cells stained with NAO and DAPI. Panels A and B show the same cell stained with NAO and DAPI, respectively. Panel C shows the overlay of the images in panels A and B. Panel D shows the overlay of NAO and DAPI staining. Stains, NAO (green) and DAPI (red). Bar, 2.5 μM.

