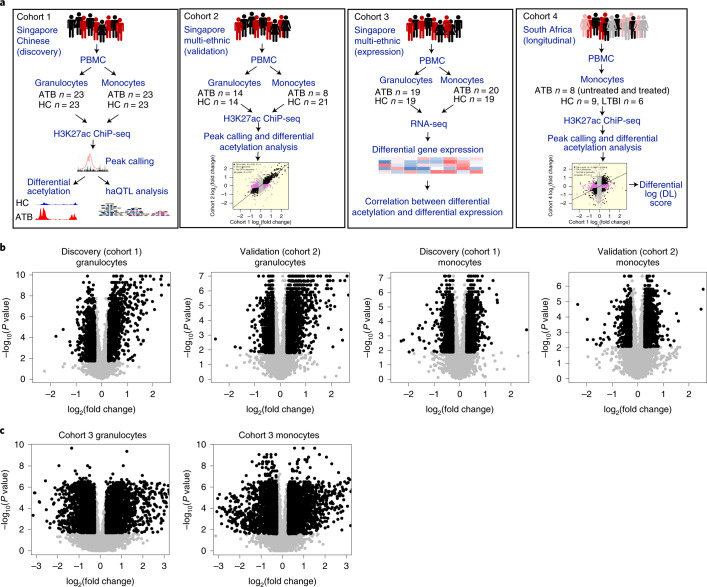
Fig. 1. Histone acetylome-wide association study of TB.
a, Overview of data generation and analysis. b, Volcano plots showing log2(fold change) and P value for consensus ChIP-seq peaks (black dots, DA peaks; see Methods). P value for each peak was calculated using a 2-sample two-sided Wilcoxon test and fold change was computed from the median of the peak heights. c, Volcano plots showing log2(fold change) and P value for expressed genes (black dots, DE genes, grey dots, non-DE genes; see Methods). P value for each gene was calculated using a 2-sample two-sided Wilcoxon test and fold change was computed from the median of the gene expression.

