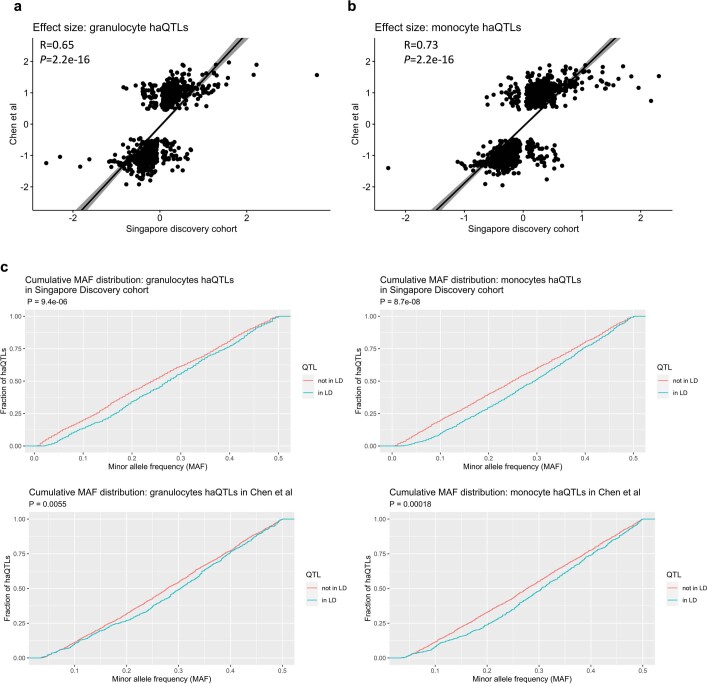
Extended Data Fig. 5. Comparison of haQTLs from different studies.
Comparison of granulocyte (a) and monocyte (b) haQTL effect size between the Singapore discovery cohort (Chinese) and the European cohort19. Each dot represents an haQTL in the Singapore discovery cohort (x-axis) and a corresponding European19 haQTL in LD with the former. Effect size is defined as the regression coefficient beta relating ChIP-seq peak height to genotype. R: Pearson correlation. P-value: two-sided Pearson correlation P-value. (c) Cumulative minor allele frequency distributions for granulocyte and monocyte haQTLs in the Singapore discovery cohort (Chinese) and the European dataset19. Blue curves: shared haQTLs. Red curves: cohort-specific haQTLs. The statistical significance (Kolmogorov-Smirnov test, two-sample, two-sided) of the shift in allele frequency between shared and non-shared haQTLs is indicated in each panel.

