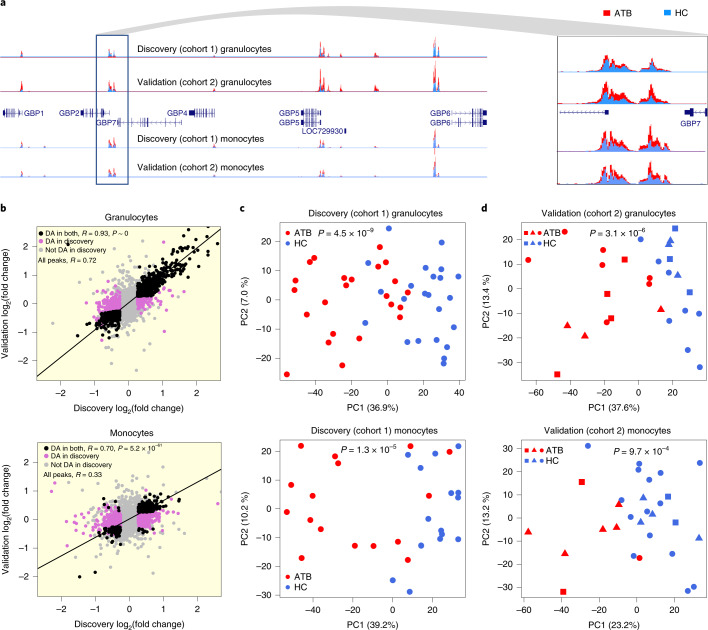
Fig. 2. Differentially acetylated (DA) peaks between ATB and HC.
a, Histone acetylation profiles showing consistent differences between ATB (red) and HC (blue) in the GBP locus. b, Scatterplot of ATB-vs-HC fold change in Singapore discovery and validation cohorts. R indicates Pearson correlation coefficient of log2(fold change) between discovery and validation. P value of concordance in fold-change direction for shared DA peaks was calculated using two-sided Fisher’s exact test. Black dots are DA both in discovery and validation cohorts. Pink dots are DA only in the discovery cohort. Grey dots are not DA in discovery cohort. c, Discovery cohort (exclusively Chinese). PCA of granulocyte and monocyte peak heights. d, Validation cohort (multi-ethnic). PCA of granulocyte and monocyte peak heights. In c and d, PCA was based on the discovery DA peak set and P values are from two-sided t-test of ATB-vs-HC PC1 values. Squares, Indian; circles, Chinese; triangles, Malay.

