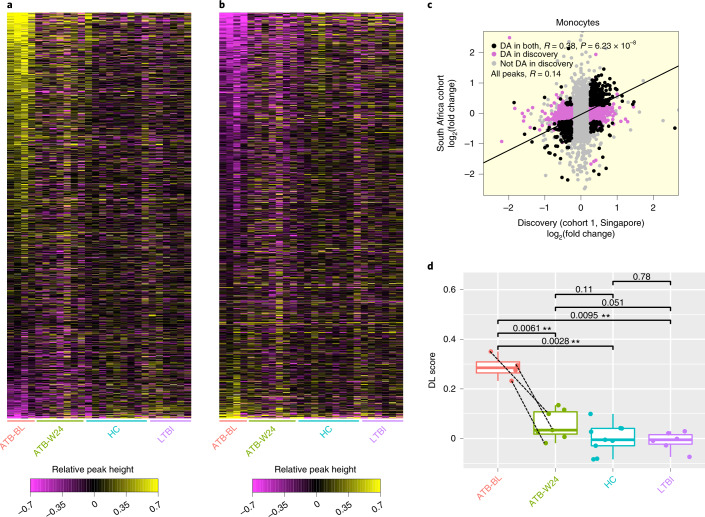
Fig. 3. Reproducibility of differential H3K27 acetylation in monocytes.
a, Each row represents an H3K27ac peak that showed increased acetylation in ATB relative to HC in the Singapore discovery cohort (‘Up’ DA peaks). Each column represents a sample in the longitudinal South African cohort (Cohort 4). The heat map is coloured on the basis of relative peak height, calculated as: log2(peak height in sample) – average(log2(peak height in HC)). ATB-BL, ATB at baseline (untreated); ATB-W24, ATB after 24 weeks of treatment. b, Same as a, but for peaks with decreased acetylation in ATB relative to HC in the Singapore discovery cohort (‘Down’ DA peaks). c, Scatterplot of ATB-vs-HC peak height fold change in the Singapore discovery cohort and the South African cohort. d, The differential log(peak height) values shown in b were averaged across all Up DA peaks to calculate a differential log (DL) score for each sample. Dashed lines indicate samples from the same individual. Two-sided t-test, **P < 0.01. ATB-BL n = 4, ATB-W24 n = 7, HC n = 9, LTBI n = 6. The box shows the 25th and 75th percentiles, the median is indicated by a thick horizontal line, and the ends of the whiskers (segments) indicate 1.5 times the interquartile range.

