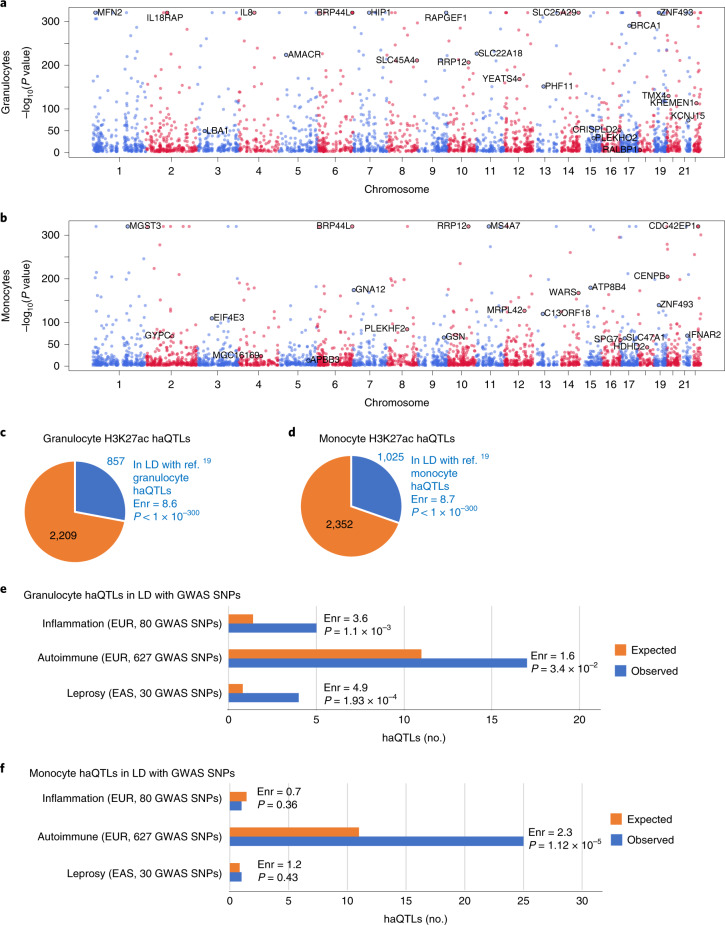
Fig. 6. Landscape of haQTLs in granulocytes and monocytes.
a,b, Manhattan plots of haQTL distribution in granulocytes and monocytes. Gene names are indicated next to haQTLs that are in LD with eQTLs in the same cell type. Granulocyte eQTLs were obtained from Naranbhai et al.45 and monocyte eQTLs from Fairfax et al.46. The alternating red and blue colours of the dots are used to delineate chromosomes. P values are from the G-SCI test (details in Supplementary Methods, ‘Histone Acetylation QTLs’). c,d, Pie charts of granulocyte and monocyte haQTLs identified in this study that are in LD with haQTLs from a previous study. Fold enrichment (Enr) and P value of haQTL overlap relative to randomly chosen SNPs in peaks are indicated (details in Supplementary Methods, ‘Overlap with published haQTL datasets’). e,f, Number of non-redundant granulocyte and monocyte haQTLs in LD with genome-wide significant GWAS SNPs. Orange bars, expected number of haQTLs adjusted for minor allelic frequency distribution and distance to the nearest transcription start site; blue bars, observed; P values, Z-score test (details in Methods, ‘Statistical significance of LD between haQTLs and GWAS SNPs’); EUR, European; EAS, East Asian.

