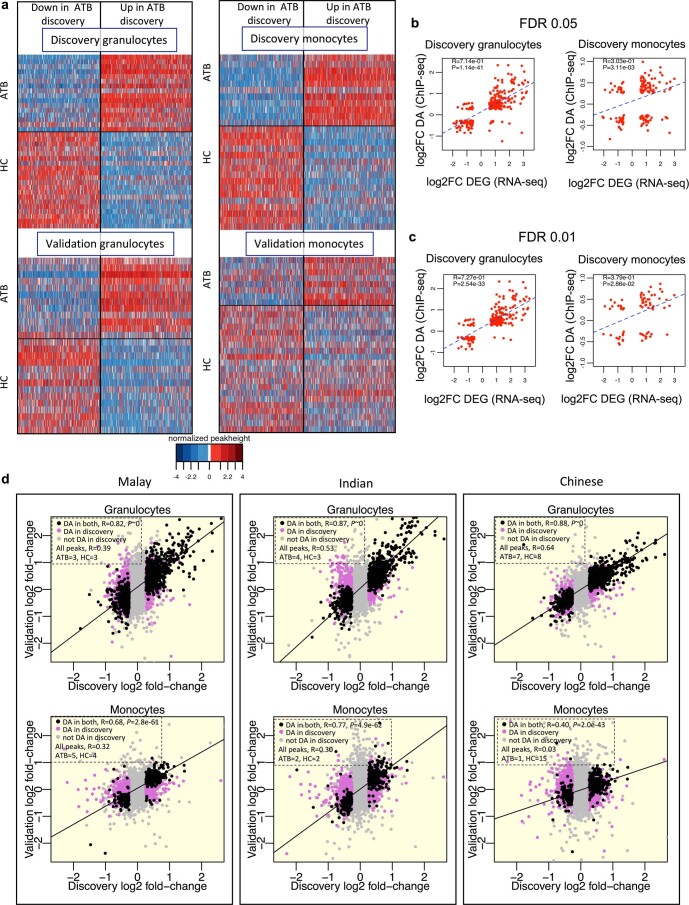
Extended Data Fig. 2. ChIP-seq peak height z-scores, fold change correlation of ChIP-seq and RNA-seq data, and ethnicity-specific fold-change correlation for ChIP-seq data.
(a) DA peak height z-scores for the four ATB vs. HC Singapore (discovery and validation) datasets from samples from the core set. Each row represents a single individual, and each column a DA peak ascertained from the discovery cohort. The peaks in the top and bottom panels are arranged in the same order. Only consistent samples are displayed (granulocytes discovery: ATB = 16, HC = 20; monocytes discovery: ATB = 11, HC = 16; granulocytes validation: ATB = 12, HC = 14; monocytes validation: ATB = 8, HC = 21). (b,c) Correlation between differential acetylation and differential gene expression (related to Supplementary Table 18). DE and DA gene sets were defined using the default FDR threshold of 0.05 (b) as well as a more stringent FDR threshold of 0.01 (c). DA peaks were associated with DE genes using the GREAT tool and the Pearson correlation of log-fold change was calculated. P-values indicate concordance of the fold-change direction, calculated using a one-sided hypergeometric test. (d) Ethnicity-specific fold-change correlation between discovery and validation cohorts. Black dots are DA both in discovery and validation cohorts. Pink dots are DA only in the discovery cohort. R indicates Pearson correlation coefficient of log2(fold-change) between discovery and validation. P-value of concordance in fold-change direction for shared DA peaks was calculated using two-sided Fisher’s exact test.

