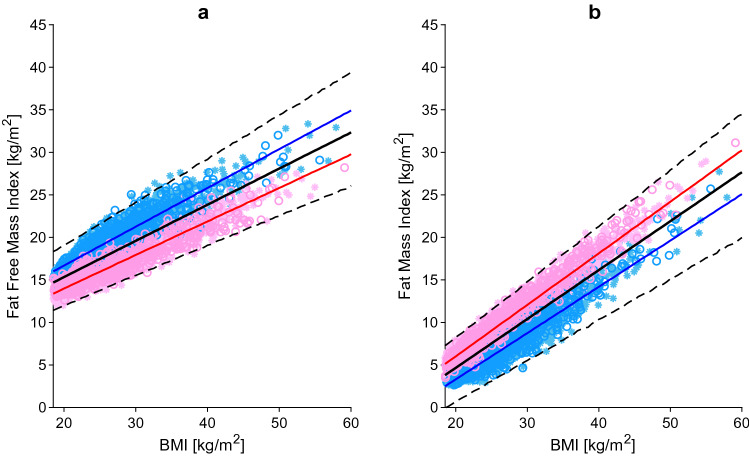
Fig. 1.
Fat-free mass index (a) and fat mass index (b) relative to BMI. The blue, red and black lines represent the predicted mean of virtual male individuals, virtual female individuals and from all virtual subjects, respectively. The area within the two dashed lines represents the 99% normal range. Asterisks represent observed data from the development and circles represent observed data from the independent verification dataset. Male and female data points are represented in light blue and pink, respectively. BMI body mass index

