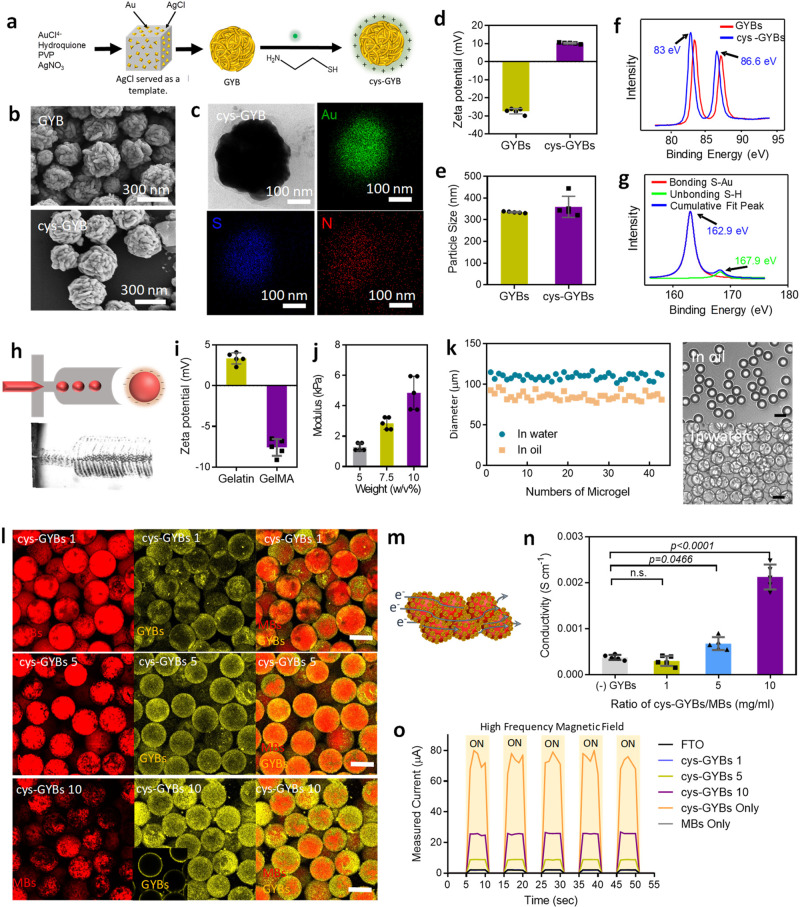
Fig. 2. Preparation and characterization of conductive microporous hydrogel (CMH).
a Schematic illustration of synthesis of cys-GYBs. b Scanning electron microscopy (SEM) images of GYBs and cys-GYBs. c TEM images of cys-GYBs and distribution of the elemental mapping of Au, S and N. d–e The surface charge of GYBs and cys-GYBs and zeta-potential measurements. Error bars represent mean ± s.d., n = 5. HRXPS analysis of GYBs and cys-GYBs via (f) Au4f signal and (g) S2p signal. h Microscope image of the device generating GelMA droplets. i Zeta potential of gelatin and GelMA. Error bars represent mean ± s.d., n = 5. j Compressive modulus of GelMA at various concentration. Error bars represent mean ± s.d., n = 4. k Droplet size distribution of MBs in water and in oil. l Fluorescence images show the beads (red) with cys-GYBs (yellow) for visualization at different volume ratios. Scale bar: 100 μm. m Schematic of conductive microporous hydrogel. Blue line describes the proposed electron (e−) transfer passing through each CMH. n Electrical conductivity in the various hydrogels (n = 6, mean ± s.d., one-way ANOVA with Tukey’s multiple-comparison test). o Output currents on various materials generated by HFMF with on/off control.

