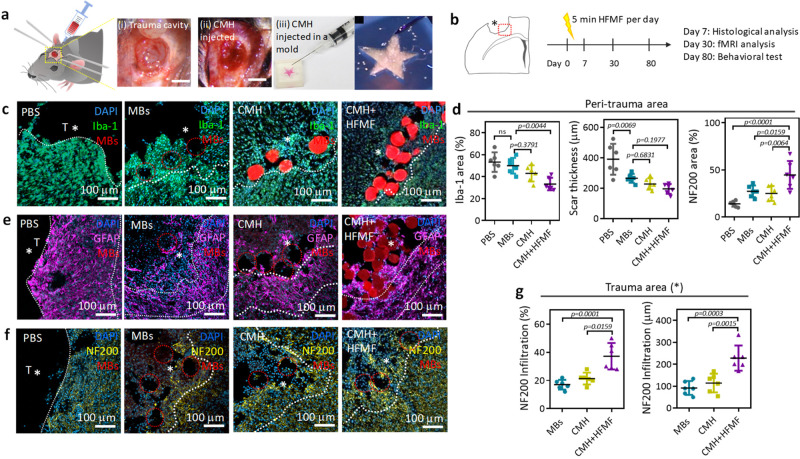
Fig. 5. Animal study.
a Images of the TBI cavity before and after implanting the CMH scaffold (left panel). Images of CMH injected into a star-shaped mold via a syringe (right panel). b Schematic of the in vivo experimental timeline, including the sacrifice and analysis time points. c Fluorescence images of Iba-1 immunostaining after treatment with PBS, MB, CMH, and CMH + HFMF. d Analysis of Iba-1, scar thickness and NF200-positive responses at peri-trauma areas (n = 6, mean ± s.d., one-way ANOVA with Tukey’s multiple-comparison test). Fluorescence images of (e) GFAP and (f) NF200 immunostaining after various treatments. g Analysis of the NF200-positive responses and infiltration distance in the trauma area. (n = 6, mean ± s.d., one-way ANOVA with Tukey’s multiple-comparison test).

