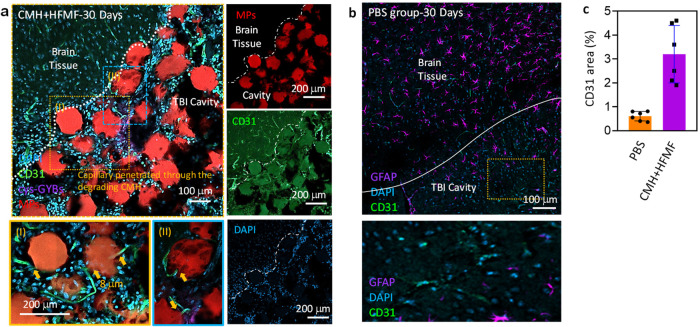
Fig. 6. Endothelial cells (ECs) infiltrated and ingrowthed within channel network hydrogels from 30 days implantation in mouse.
Fluorescence images of blood vessels (CD31) in green), nucleic (DAPI) in blue and MBs (RITC) in red around the trauma site at 30 days postsurgery. a ECs lining a microchannel network in vivo after treated by cys-GMH + HFMF group (I and II: a cross-section view of EC-lined channel). Scale bar = 150 µm. b The fluorescence images of control group. c Quantification of CD31 area of images at TBI cavity Error bars represent mean ± s.d., n = 6.

