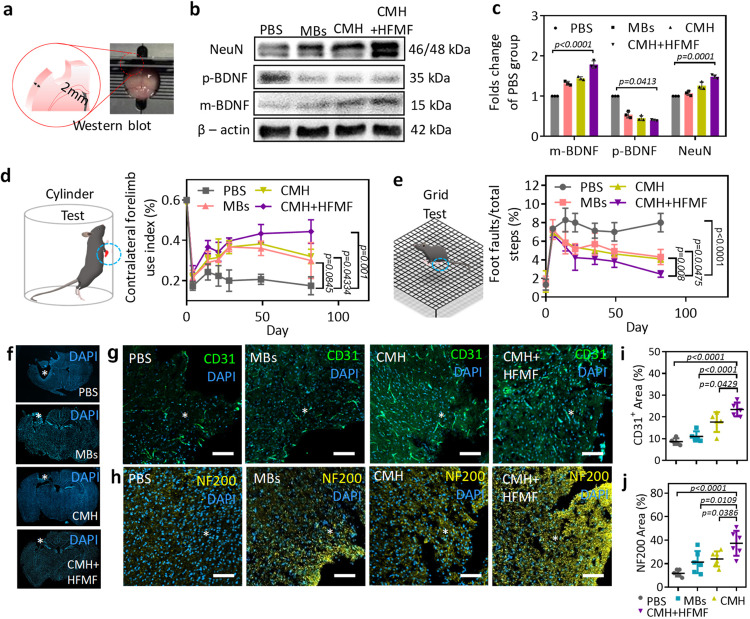
Fig. 8. Western blot analysis and post-TBI neurological recovery and axonal sprouting.
a Tissue slice of trauma area of ipsilateral brain slice with 2 mm. b Western blot analysis of brain. β-actin was selected as the internal control with a protein weight of 42 kDa; the values of m-BDNF and p-BDNF were 15 and 35 kDa, respectively. NeuN was 46 and 48 KDa, respectively. c The quantitative results of proteins are expressed as the ratio of densitometries of m-BDNF, p-BDNF and NeuN to β-actin bands. Error bars represent mean ± s.d., n = 6, one-way ANOVA with a Tukey’s post-hoc test. d The cylinder test to evaluate the dexterity of their contralateral forelimb. Error bars represent mean ± s.d., n = 6, one-way ANOVA with a Tukey’s post-hoc test). e The grid test for the contralateral hindlimb normally sensitive to post-TBI lateralized impairments. Error bars represent mean ± s.d., n = 6, one-way ANOVA with a Tukey’s post-hoc test). f Representative brain images illustrated cavity of tissue loss (white circle) in mice at 82 days postinjury. Fluorescent images of (g) endothelial cells (CD31) and (h) axonal neurofilaments (NF200) around the TBI site (*) at 60 days postinjury. Quantification of the (i) vessels (CD31) and (j) axonal area (NF200) in the ipsilateral peri-trauma cortex at 60 days after TBI. Error bars represent mean ± s.d., n = 6, one-way ANOVA with a Tukey’s post-hoc test). Scar bars: 100 μm.

