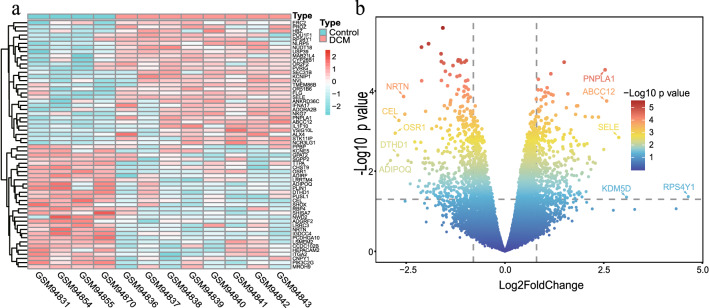
Figure 2.
DEGs differential analysis of GSE4172 dataset. (a) Heatmap of DEGs in GSE4172 dataset (n = 60, p < 0.05, |log2 FoldChange|≥ 0.8). (b) Asymptotic volcano map of gene expression in the GSE4172 dataset. The two vertical lines indicated gene expression ploidy changes > 0.8 and < -0.8, respectively, and the horizontal line indicated a p value of 0.05. The color of the dots represented the level of the p value. The top 10 significantly expressed genes among the DEGs were labeled on the graph.

