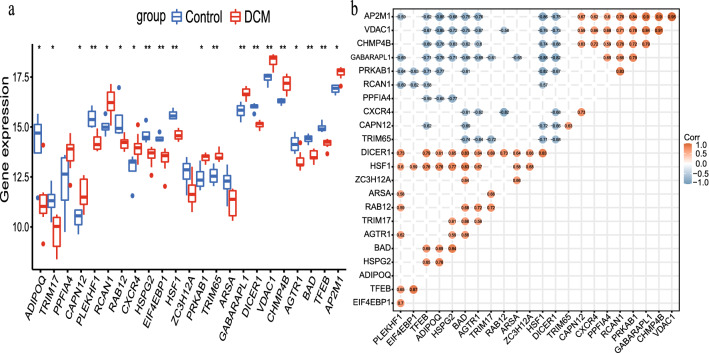
Figure 4.
23 AR-DEGs in dilated cardiomyopathy (DCM) group and control group and their correlation. (a) Box plot of the expression levels of 23 DEGs-Down in the DCM and control groups. The blue box plots above the corresponding gene names indicated expression in control groups, whereas the red box plots indicated expression in DCM groups. (b) Correlation heatmap of 23 AR-DEGs. The color within the circle shape and the magnitude of the correlation value represented the strength of the correlation; red represented positive correlation and blue represented negative correlation. The darker the color, the larger the absolute value of the correlation value represented a stronger correlation.

