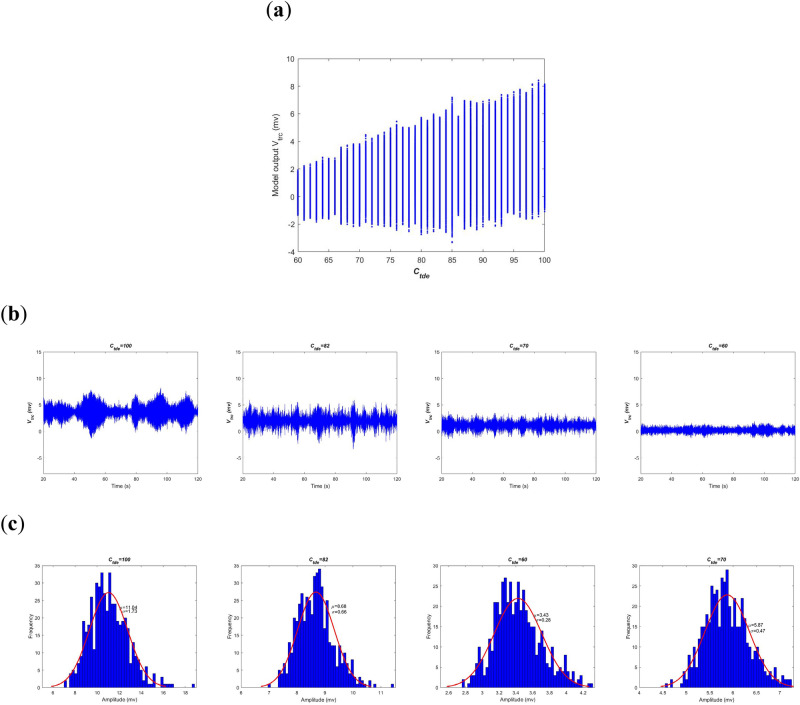
Figure 3.
Amplitude analysis of the BTC model output in time-domain when the excitatory synapse connectivity parameter from PNN to TRC is varied in the range of [60, 100]. (a) The model output of the summated postsynaptic potential for each . (b) Diagram of the summated postsynaptic potential during [20, 120]s when takes some different values of 100, 82, 70 and 60. (c) Amplitude distribution of based on 500 realizations of postsynaptic potential when takes some different values of 100, 82, 70 and 60.

