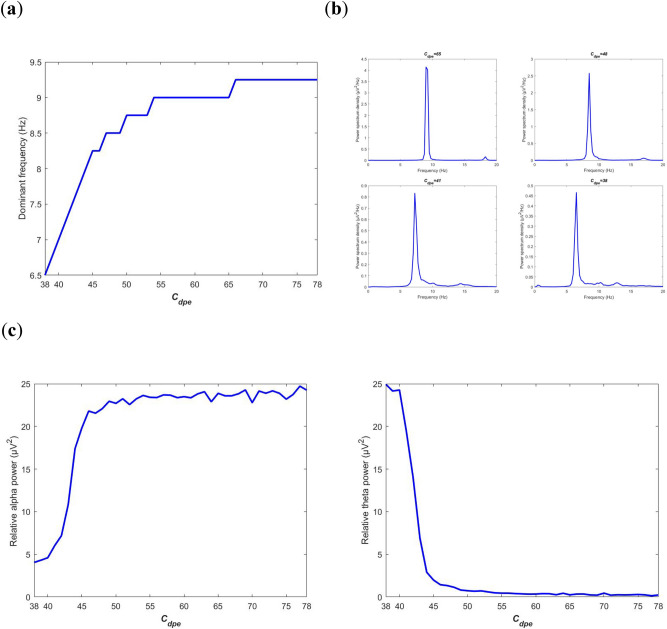
Figure 6.
Power spectrum analysis of the BTC model output in frequency-domain when the excitatory synapse connectivity parameter from PY to PNN is varied in the range of[38,78]. (a) Dependence of the dominant frequency of the model output on . (b) The power spectrum density when takes some different values of 65, 48, 41 and 38. (c) The evolution of relative power in specific bands: alpha band (left panel) and theta band (right panel).

