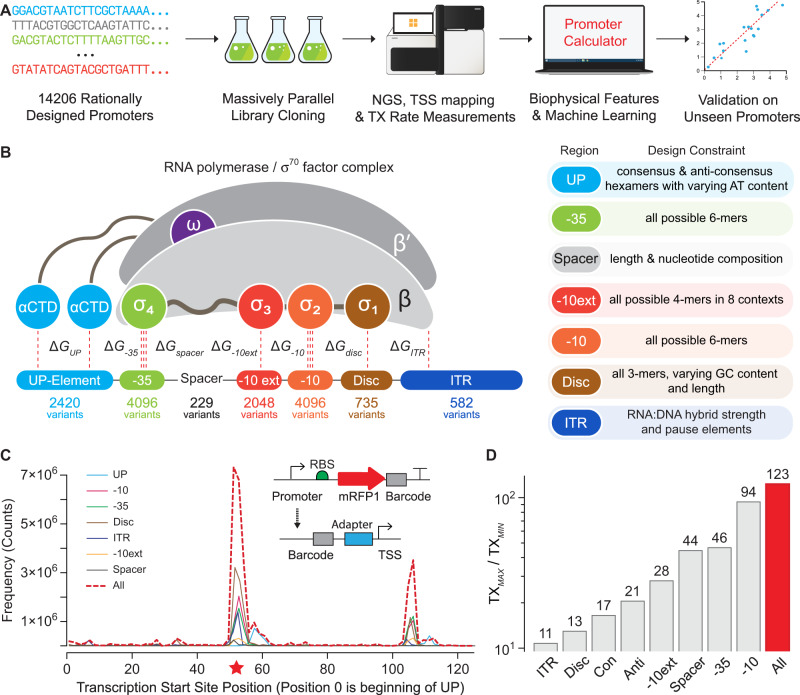
Fig. 1. Massively Parallel Transcription Rate and Start Site Measurements.
A Model development combined promoter design, barcoded oligopool synthesis, library cloning & culturing, and next-generation sequencing to measure the transcription start site distribution and transcription rate of each promoter variant. B The interaction strengths between RNAP/σ70 and promoter DNA control transcription initiation rates. 14206 promoter variants were designed to quantify how sequence modifications affect each interaction. Sequence design criteria are shown. C The frequencies of observed transcription start sites are shown for each set of promoter variants. The star indicates the predominant start site. The inset schematic shows the system architecture, the locations of the promoter and barcode variants, and the cDNA architecture after library preparation. D The transcription rates’ dynamic ranges are shown for each set of promoter variants, considering only the predominant start site. Con: UP element promoter variants with consensus hexamers. Anti: UP element promoter variants with anti-consensus hexamers. Data are provided in Supplementary Data 1.

