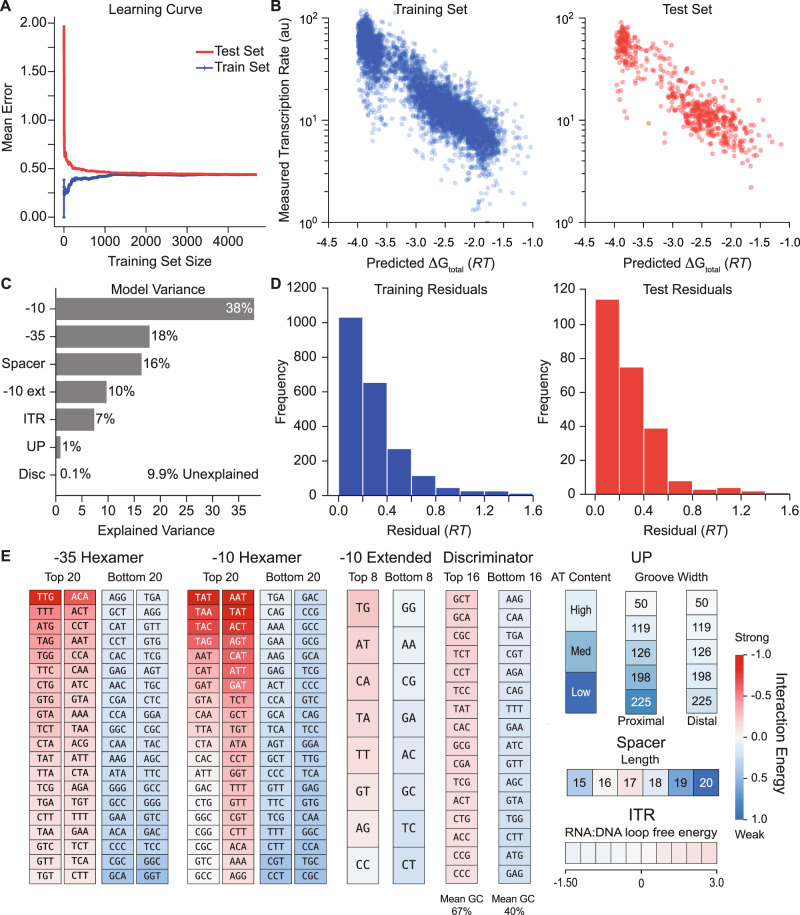
Fig. 2. Model Development and Validation using Machine Learning.
A A learning curve shows the training and testing of a ridge regression model to identify the unknown interaction energies. B Model-predicted free energies are compared to measured transcription rates for both (left) the training set and (right) the unseen test set. Pearson correlation coefficient (R2) is equal to 0.80 for both the training and test sets. C The explained variances for each promoter interaction are shown. D Histograms of model error are shown for the training and test sets, using energy units. Mean absolute error (MAE) is equal to 0.27 RT for the training set (left) and 0.28 RT for the test set (right). E The learned interaction energies are shown for the strongest and weakest ones. A poster-sized schematic showing all interaction energies is available (Supplementary Information). Data are provided in Supplementary Data 1.

