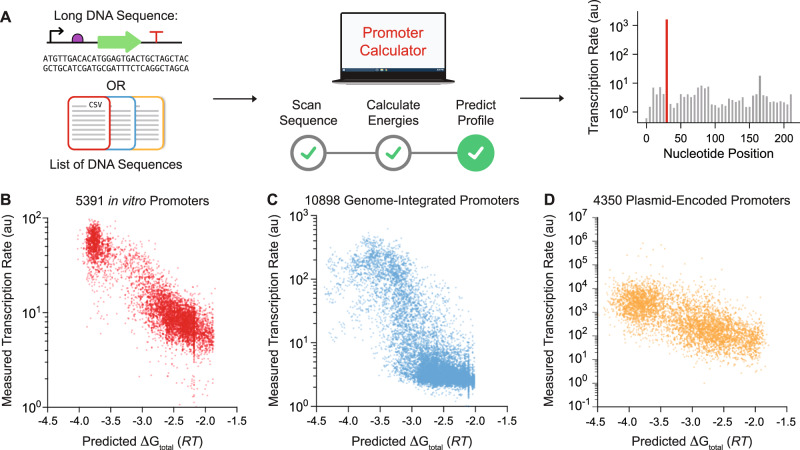
Fig. 3. Validation of Sequence-to-Function Model on Diverse Promoters.
A Arbitrary DNA sequences are inputted into the model to predict its transcriptional profile (transcription rates vs. nucleotide positions) without start site information. B Model comparisons on 5391 designed promoters (LaFleur et al., this study) are compared to in vitro transcription rate measurements (R2 = 0.79, Spearman’s ρ = 0.80, MAE = 0.33 RT, MSE = 0.18 RT). C Model predictions on 10898 genome-integrated modular promoters16 characterized by Urtecho et al. are compared to in vivo transcription rate measurements (R2 = 0.60, Spearman’s ρ = 0.67, MAE = 0.93 RT, MSE = 1.28 RT). D Model predictions on 4350 non-repetitive plasmid-encoded promoters12 characterized by Hossain et al. are compared to in vivo transcription rate measurements (R2 = 0.45, Spearman’s ρ = 0.69, MAE = 1.08 RT, MSE = 1.88 RT). MAE and MSE were determined by fitting a proportionality constant (best-fit slope) accounting for experimental variation. Data are provided in Supplementary Data 1.

