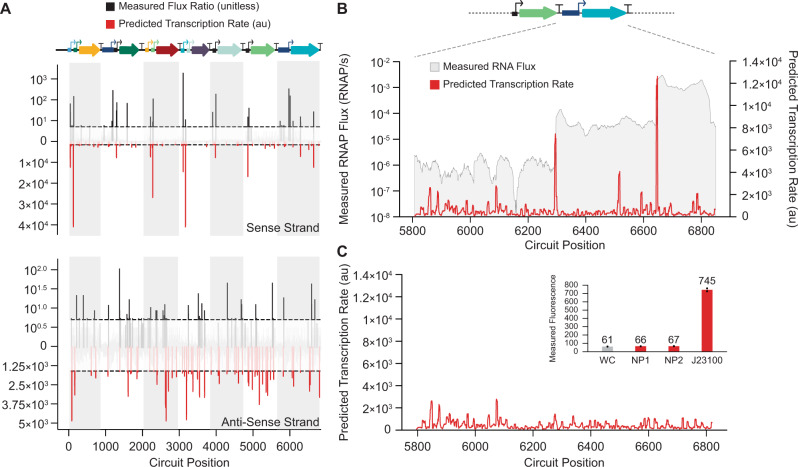
Fig. 6. Genetic Circuit Debugging Through Cryptic Promoter Identification.
A The predicted σ70 transcriptional profile of an 11-promoter genetic circuit8 is compared to in vivo transcription rate and start site measurements on the (top) sense and (bottom) anti-sense strand. Transcription flux ratios are the measured differences in adjacent mRNA levels from RNA-Seq. White and gray shadows correspond to each transcribed cistron. The horizontal dotted black lines show the minimum transcription rates that define a start site. Experimental TSS cutoffs are previously described8, and prediction cutoffs are defined in the Methods. Annotated start sites are depicted in the circuit diagram with arrows. B The predicted σ70 transcriptional profile for the PBAD-amtR portion of the circuit in the OFF state. Red lines are model predictions, and gray overlays show measured RNAP flux. C The predicted σ70 transcriptional profile for a redesigned amtR protein coding sequence that minimized the transcription initiation rate inside the coding sequence. (inset) Measured fluorescence levels for designed no-promoter regions predicted to have minimal transcription rates (NP1: 120-bp, NP2: 60-bp) as compared to (WC) white cells and the J23100 promoter. Black dots denote independent measurements. Bars denote the mean across duplicate measurements (n = 2 biological replicates). Data are provided in Supplementary Data 1.

