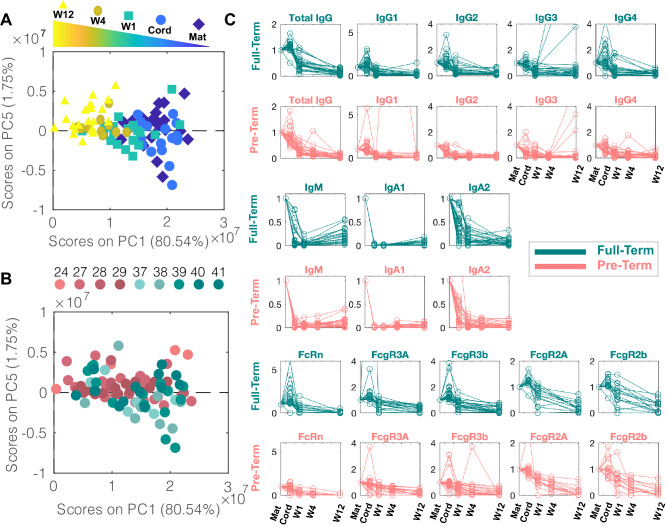
Figure 2.
Convergence of antibody profiles over time. (A, B) Principal Component Analysis (PCA) was performed to reduce the dimensions of data from 323 to 5 dimensions to visualize the major axes of variation across the whole dataset. Each dot represents a sample. (A) 80% of the variance was captured by PC1, capturing the major variance in the data, picking up the evolution of the humoral profiles over time. The dot color represents the sample origin (maternal, cord, and time after birth). (B) In contrast to PC1, PC5 captures differences in antibody profiles across the PT and FT infants, where the dot color depicts the gestational group of the sample. (C) Each trendline represents the median of each antigen-specific measurement. These were normalized to the median of the maternal level of that antigen-specific measurement such that all trendlines start at a normalized value of 1. These were calculated separately for PT (pink) and FT (green) infants. One trendline is included per antigen per graph. Median tetanaus-, diphtheria-, and pertussis-specific (tdap) IgG3 peak at W12 for both pre-term and FT children, consistent with the Tdap administration to children between 6 and 8 weeks in Sweden.

