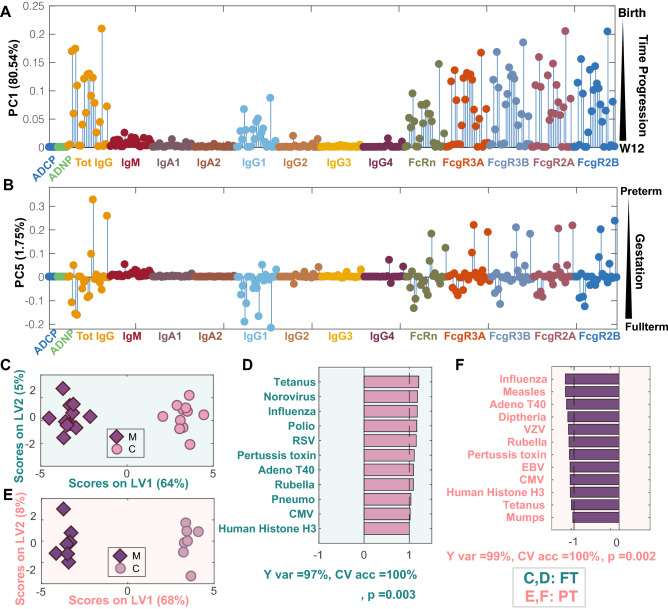
Figure 3.
Antigen-specific transfer varies in PT infants. (A, B) The graphs depict the loading values on PC1 (A) and PC5 (B) of the PCA scores plot from Fig. 2. (A) Loadings on PC1 capture the changes over time. Each dot represents an antigen, and dot colors depict different Fc-readouts. (B) Loadings on PC5 reflect differences with gestational age. The order of antigens shown from left to right for all Fc measurements with the exception of ADCP and ADNP are: measles, mumps, rubella, pertussis toxin, influenza, VZV, polio, HepA, pneumo, Adeno T5, Adeno T40, Norovirus, Parvo VP2, tetanus, diphtheria, HSV1, HSV2, CMV, EBV, RSV, Human Histone H3, nArah2, nBosd8, nBetv1. Antigen specificities from left to right for ACDP: RSV, pneumo, pertussis toxin, rubella, influenza. Antigen-specificities for ADNP from left to right: rubella, pertussis toxin, influenza, pneumo, CMV, RSV. (C) ML-PLSDA depicts the antigen-specific differences across FT maternal:cord pairs. The model was orthogonalized such that the separation of maternal and cord antibody profiles was captured on Latent Variable 1 (LV1), capturing 83% of the Y-variation. Conversely, LV2 captures the variability in the antibody features that do not contribute to the separation (Y var = 0%). (D) The bar graph depicts the VIP scores for loadings on LV1. Only the top contributors to the separation with VIP score > 1 are shown, all of which are higher in cord blood. A fivefold cross validation (CV) of the model resulted in CV accuracy of 85%. This model outperformed 93% of label-shuffled random models (Wilcoxon p = 0.07). (E) The ML-PLSDA scores plot depicts differences in antibody profiles in maternal:cord PT pairs. In this orthogonalized model, the separation of PT maternal and cord antibody profiles was captured on LV1, capturing 73% of the Y variation. LV2 captures 0% of Y var variation. (F) VIP scores for loadings on LV1 (VIP scores > 1) highlight higher antigen-specific antibody levels in maternal plasma. A fivefold cross validation of the model resulted in a CV accuracy of 69%. The model outperformed 85% of models based on randomly label-shuffled inputs (Wilcoxon p = 0.15).

