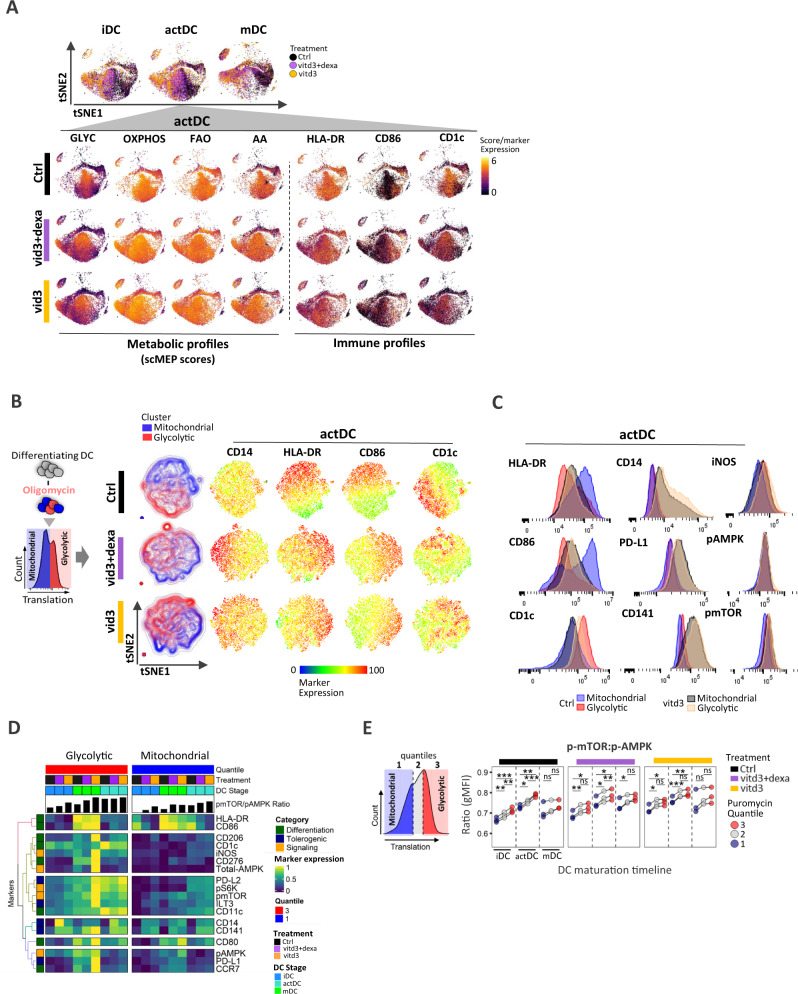
Fig. 6. Distinct metabolic states of mitochondrial and glycolytic cell populations exhibit unique immune activation DC profiles in control and tolerogenic culture conditions.
A tSNE maps based on metabolic marker expression of control (black), vitd3+dexa (purple) and vitd3 (orange)-treated DC across three maturation stages from one donor (out of N = 3 donors) are shown. Heatmap overlay of single-cell scMEP metabolic pathway scores and expression of DC-lineage markers are depicted at actDC stage to emphasize both immune and underlying metabolic heterogeneity including differences between control and tolerogenic DC. B Schematics of oligomycin-treated SCENITH samples, which separates cells that can effectively utilize glycolysis (red population) for producing ATP measured by protein synthesis when mitochondrial respiration is inhibited. Puromycin/ protein synthesis histograms represent cells isolated from single oligomycin-treated wells. Control (black), vitd3+dexa (purple) and vitd3 (orange)-cultured samples after oligomycin treatment exhibit glycolytic (red) and mitochondrial-dependent (blue) DC subsets in a tSNE clustering based on immune markers. Single-cell heatmap expression overlays emphasize differences in surface marker expression between glycolytic and mitochondrial DC subsets. C Flow-cytometry histogram profiles for differential SCENITH panel markers in glycolytic (red, orange) and mitochondrial (blue, black) populations in control and vitd3-tol-DC samples. Representative histograms from single donor (out of N = 3 donors) are shown. D Heatmap of gMFI SCENITH marker profiles in glycolytic and mitochondrial metabolic clusters from control, vitd3+dexa and vitd3 DC across distinct maturation stages. Mean expression values from three independent donors are presented. Donor label, treatment and DC differentiation stages are annotated along with the calculated mTOR:AMPK phosphorylation ratio. Marker colors represent functional categories. E Schematics of puromycin/protein synthesis quantile levels in oligomycin-treated SCENITH samples. Dot plots show calculated comparisons of p-mTOR:p-AMPK ratio changes between individual quantiles within respective treatment groups across maturation stages from three independent donors. Lines connect data points from an individual donor. Statistical significance was calculated via one-way ANOVA with Tukey’s post-hoc test. For all panels, P-values are represented as *p ≤ 0.05, **p ≤ 0.01, ***p ≤ 0.001, ****p ≤ 0.0001. p-values < 0.05 were considered statistically significant (ns). Source data are provided as a Source Data file.

