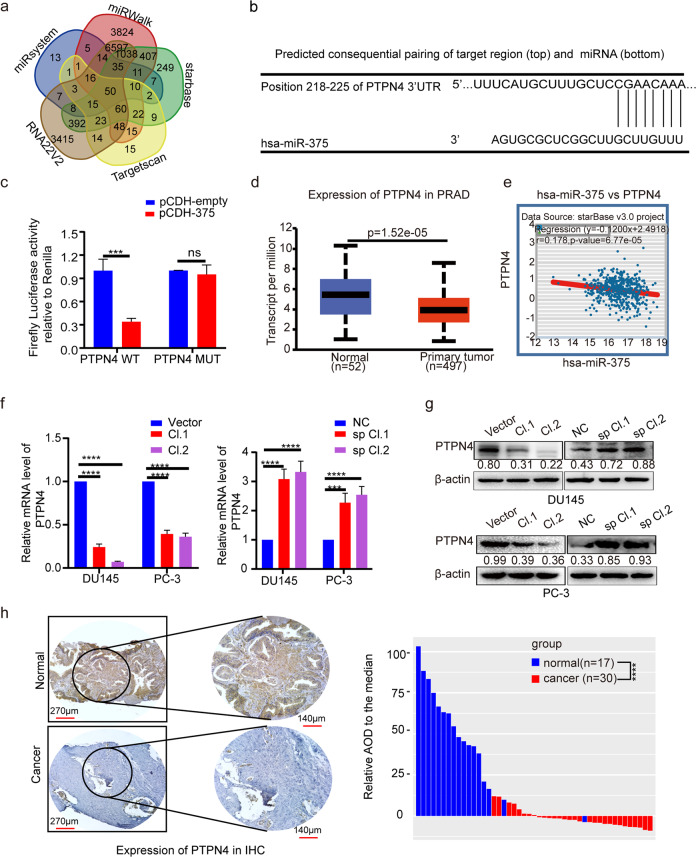
Fig. 3. MiR-375 targeted and negatively regulated PTPN4 in PCa.
a Potential target genes were predicted using the miRsystem, miRWalk, StarBase, TargetScan and RNA22v2 databases. A total of 50 genes were found to be shared in the five databases. b The potential binding site of miR-375 with the 3′-UTR of PTPN4 was predicted using the TargetScan database. Complementary sequences consisting of 8 nt were aligned and presented. c A luciferase assay was conducted to validate the direct binding and modulating function of miR-375 to the 3′-UTR of PTPN4. PCDH-empty: HEK-293 cells transfected with the pCDH-CMV vector. PCDH-375: HEK-293 cells transfected with pCDH-CMV vector that was subcloned with a fragment of pri-miR-375. PTPN4 WT: HEK-293 cells cotransfected with the P-MIR-Report firefly luciferase vector inserted with a fragment of the wild-type 3’-UTR of PTPN4 mRNA. PTPN4 MUT: HEK-293 cells cotransfected with the P-MIR-Report firefly luciferase vector subcloned with the 3′-UTR of PTPN4 mRNA mutated at the complementary site. d The expression of PTPN4 in PCa tissues compared with normal prostate tissues from the UALCAN database. e The correlation between miR-375 level and PTPN4 in PCa, statistically processed by StarBase. r = −0.178, p = 6.77e-5. PTPN4 at the mRNA level (f) and protein level (g), as determined by qRT-PCR and western blot in DU145 and PC-3 cells after miR-375 was overexpressed or knocked down. h IHC illustrating the differential expression of PTPN4 between 30 PCa and 17 normal tissues. The results show a representative IHC image (left) and quantitative analysis calculated by Image-Pro Plus version 6.0 software based on the 47 IHCs (right). AOD: average integrated optical density.

