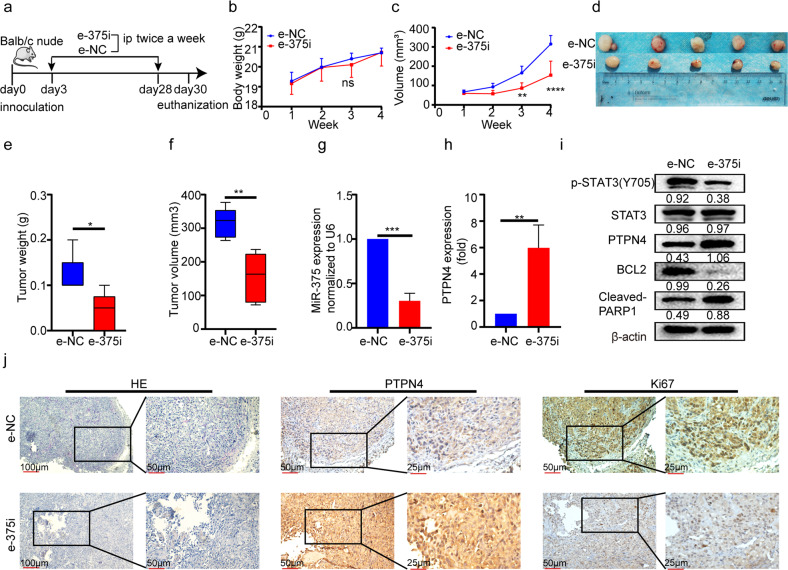
Fig. 7. E-375i inhibited PCa proliferation in vivo.
a The flow chart showing the study design. b The bodyweight of the animals and c the tumor volume during the follow-up. d Representative images of tumors, e tumor weight, and f tumor volume at the endpoint of observation. g The expression of miR-375 and h mRNA level of PTPN4 were tested by qRT-PCR in endpoint tumor tissues. i Western blot showing the expression of p-STAT3, PTPN4, BCL2 and cleaved-PARP1 in tumor tissues. j IHC analysis of the expression of PTPN4 and Ki67 in the two groups.

