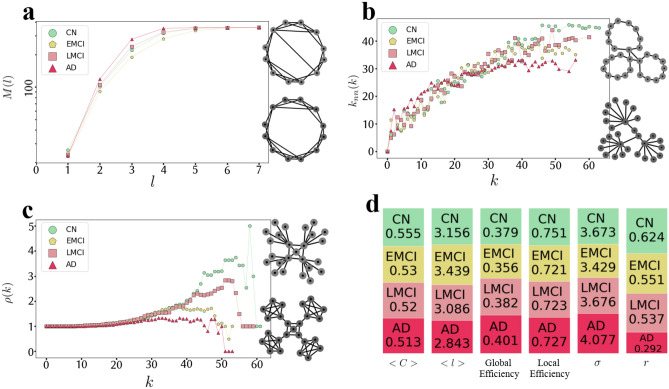
Figure 2.
The emergence of the small-worldness, assortativity, and rich-club phenomenon in the group networks. (a) M(l) plot showing the average number of vertices within a distance less than or equal to l from any given vertex is almost increased by the disease progression and suggests that the group networks have the small-world property that is almost stronger in the disease networks. Two graphs on the right-hand side are toy examples to provide intuition on the relationship between the small-world property and randomness, demonstrating the increase in the randomness of network connections (from bottom to top), which leads to the increase in the emergence of the small-world property. The bottom network is more regular, whereas the top one is more random. As a result, the average shortest path length is shorter in the random network (top) than the regular one (bottom), causing the regular network to be less small-world. (b) plot showing the average degree of the nearest neighbors, for vertices of degree k, is almost decreased by the disease progression and suggests that the group networks have assortative architecture, and this assortative matching follows a decreasing trend proportional to the disease progression. Two graphs on the right-hand side are toy examples of assortative (top) and disassortative (bottom) networks to provide intuition on the assortative patterns. As it is obvious, in the bottom network, high degree vertices are more connected with low degree vertices (disassortative pattern), whereas, in the top network, its vertices tend to make connections with other vertices that have similar degrees (assortative pattern). (c) plot showing the amount of inter-connectivity among vertices of degree higher than k is almost decreased by the disease progression and suggests that the rich-club phenomenon is disappearing by the disease progression. Two graphs on the right-hand side are toy examples of networks with (top) and without (bottom) rich-club. In the bottom network, there is no significant inter-connectivity among high-degree vertices (rich vertices). However, in the top network, which is an example of a rich-club network, high-degree vertices are completely inter-connected. (d) The bar plots showing , , global efficiency, local efficiency, (normalized / normalized ), and r (PCC between the degrees of all vertices at either ends of a link).

