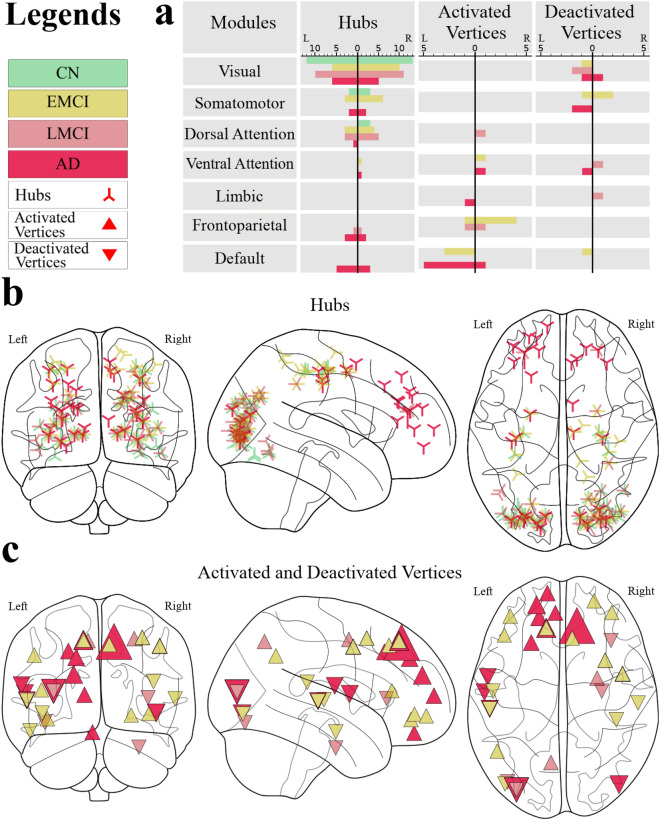
Figure 4.
The distribution of hubs, activated areas, and deactivated areas shows that anterior regions are more engaged in the diseased groups. (a) The frequency distribution across the 7-module parcellation. The left and right sides of each sub-plot denoted by a vertical black line represent the distribution across modules limited to the left and right hemispheres, respectively (b) The spatial distribution of the hub regions. The vertex size is proportional to the vertex strength. (c) The spatial distribution of vertices that are activated (denoted by ) and deactivated (denoted by ) in the diseases. A vertex was called activated (deactivated) with respect to disease if the subtraction of its strength in the disease network from the CN network was significantly larger (smaller) than the similar value for other vertices. The vertex size is proportional to the value of this subtraction. Visualizations in (b) and (c) were created using Nilearn package.

