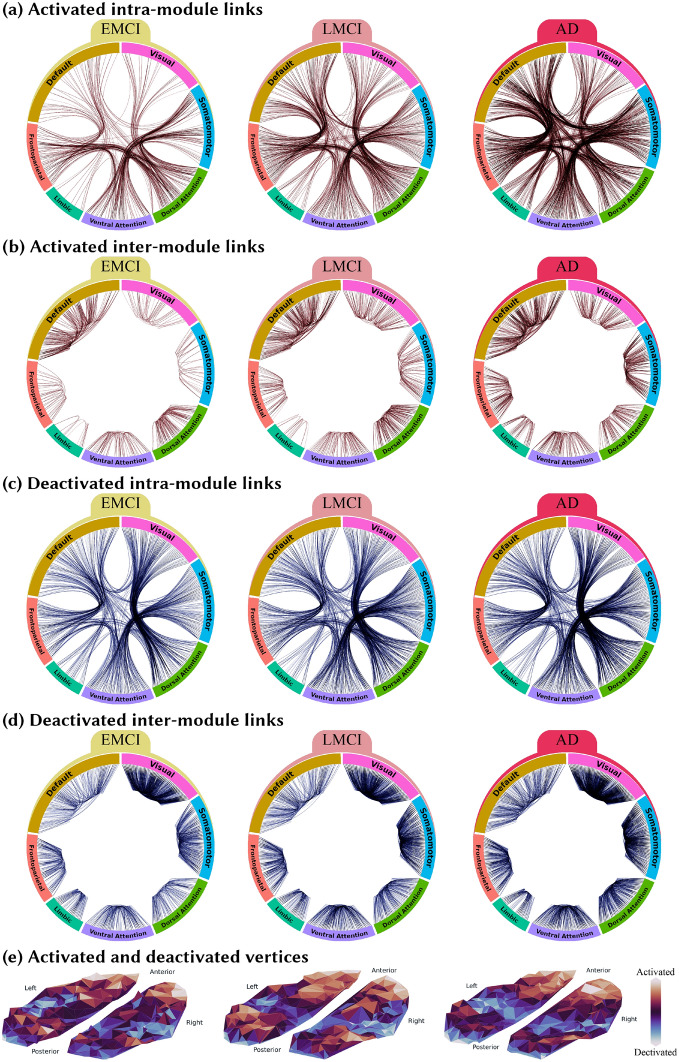
Figure 5.
The alterations in the brain functional network induced by the disease progression. For each disease stage, the connectogram of the links with significantly higher (activated) or lower (deactivated) weights compared to the CN group is depicted in the top four panels: (a) connectogram of intra-module links activated in each disease stage compared to the CN group, (b) Connectogram of inter-module links activated in each disease stage compared to the CN group, (c) connectogram of intra-module links deactivated in each disease stage compared to the CN group, and (d) Connectogram of inter-module links deactivated in each disease stage compared to the CN group. For each disease group, the activated (deactivated) links compared to the CN group are defined as the significantly larger (smaller) elements of the matrix resulting from the subtraction of the disease network from the CN network. Diagrams are plotted based on the Hierarchical Edge Bundling algorithm55 using ObservableHQ platform (https://observablehq.com). This algorithm allows bundling the intra-module links to get a more elegant presentation. Panel (e) indicates the activation or deactivation in the vertices’ strength by showing the top-view spatial distribution of the activated or deactivated vertices similar to Fig. 4c.

