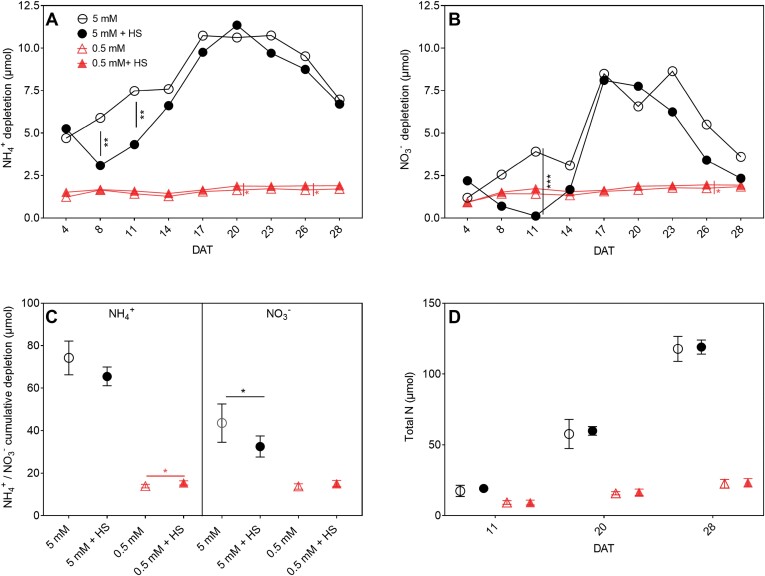
Fig. 4.
Nitrogen (NH4+, NO3−) depletion from EcoFAB-N medium over time and total N in B. distachyon grown in medium with 5 mM or 0.5 mM NH4NO3 and with or without root-associated bacteria of H. seropedicae (HS). (A) NH4+ depletion in EcoFAB medium was calculated as (initial medium NH4+ concentration at filling – final collected medium NH4+ concentration) × medium volume over time. NH4+ concentration was measured by continuous flow analysis and medium volume was measured by pipette. (B) NO3− depletion was calculated as (initial medium NO3− concentration at filling – final collected medium NO3− concentration) × medium volume. NO3− concentration were measured by ion chromatography and medium volume was measured by pipette. (C) Cumulative NH4+ or NO3− depletion by B. distachyon after 28 DAT, calculated as sum of NH4+ (A) and NO3− depletion (B) from 4 DAT to 28 DAT. (D) Total N per plant over time, measured by CHNS analyser. Points in (A–C) represent the mean of n=5 individual EcoFAB-N units each with one plant ±standard error. Points in (D) represent means ±standard error of n=3 EcoFAB-N units each with one plant at 11 and 20 DAT, and n=5 EcoFAB-N units each with one plant at 28 DAT. Asterisks indicate statistically significant difference by unpaired t-test: *P<0.05, **P<0.01, ***P<0.001. Bacterial effects (5 mM versus 5 mM+HS and 0.5 mM versus 0.5 mM+HS) are showed on the graphs; for other comparisons see Supplementary Table S3. DAT, days after transplanting into EcoFAB-N; HS, H. seropedicae.

