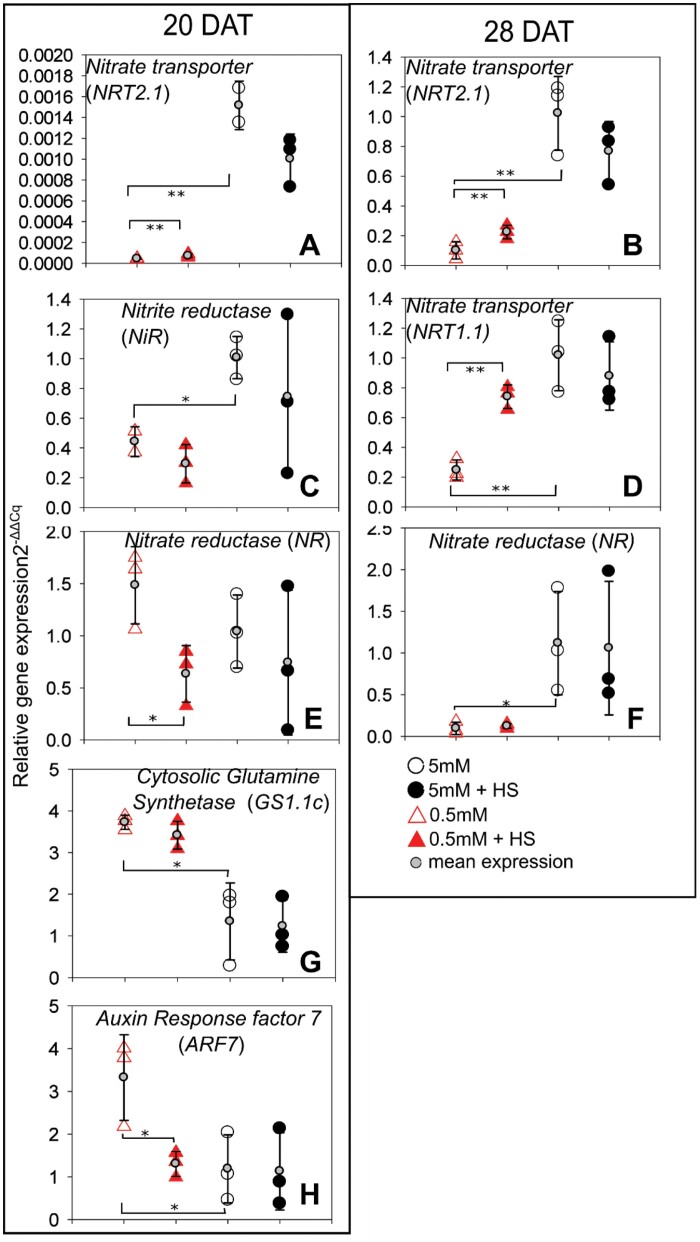
Fig. 8.
Quantitative real-time PCR of selected shoot transcripts. Relative expression levels () of NRT1.1, NRT2.1, GS1.1c, NiR, NR, and ARF7 in B. distachyon shoots grown in 5 mM NH4NO3 or 0.5 mM NH4NO3 with or without H. seropedicae (HS), in EcoFAB chambers at 20 and 28 DAT. (Additional time-points, without significant differences provided in Supplementary Fig. S4B.) Expression is normalized to UBQ10, and presented in comparison with the mean expression in 5 mM NH4NO3, which is set to 1, at each respective time point. The expression of biological replicates is depicted using large circles or triangles and the mean expression is shown on top of the biological replicates using small gray circles and standard deviation error bars. A minimum of two biological replicates are shown. Asterisks indicate statistical differences by unpaired t-test: for three comparisons: 0.5 versus 5 mM NH4NO3 and inoculated versus non-inoculated at each respective NH4NO3 level; *P<0.05, **P<0.01. y-Axis: relative expression levels (), black open circles, 5 mM NH4NO3; black filled circles, 5 mM NH4NO3 inoculated with H. seropedicae (HS); red open triangles, 0.5 mM NH4NO3; red filled triangles, 0.5 mM NH4NO3 inoculated with H. seropedicae (HS).

