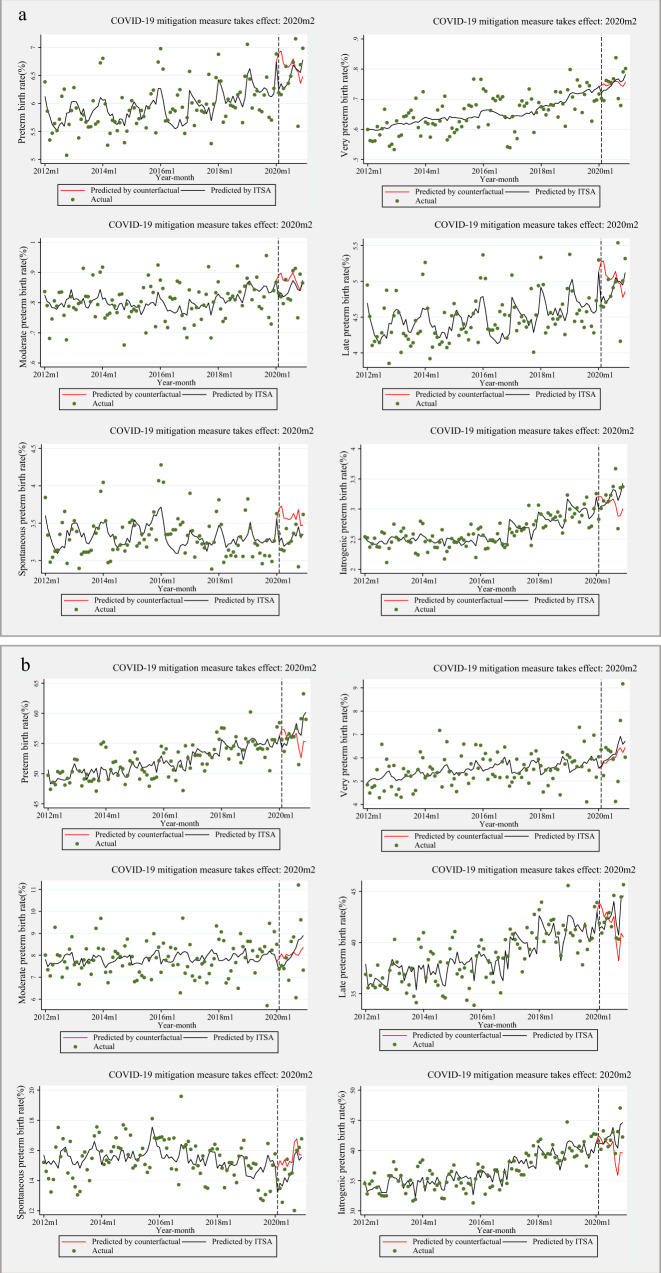
Fig. 1. Interrupted time series analysis (ITSA) of the preterm birth rate across different type pregnancies in China, 2012–2020.
a singleton births; b multiple births. Dots indicate true monthly preterm birth rates, solid lines indicate the mean of estimated preterm birth rates per month by ITSA model, and red solid lines indicate the mean of estimated preterm birth rates per month assuming that COVID-19 mitigation measure had not occurred by ordinary least-squares regression with Newey-West standard errors. Baseline: from January 1, 2012 to January 31, 2020; Intervention stage: from February 1, 2020 to December 31, 2020. COVID-19: coronavirus disease 2019. The p values are two-sided.

