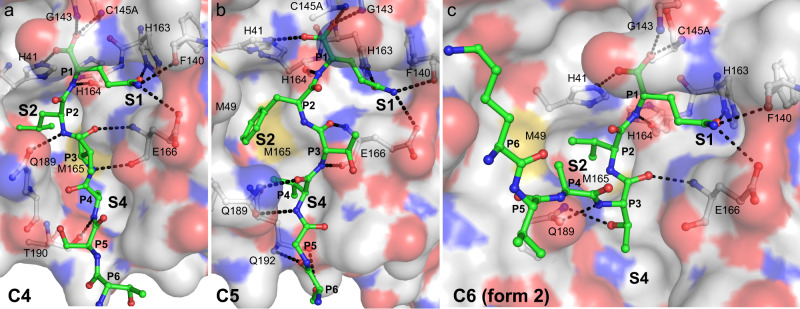
Fig. 5. S2 specificity pocket rearrangements and hydrogen bond comparison of SARS-CoV-2 Mpro cleavage sites C4, C5, and C6.
a Cleavage site C4 with P2(Leu). b Cleavage site C5 with P2(Phe) (PDB 7JOY24 used to make figure). c Cleavage site C6 form 2 with P2(Val). P6–P1 are shown in ball and stick with CPK coloring (carbons green) overlaid on the corresponding acceptor molecular surface with CPK coloring (carbons in light gray). Hydrogen bonds are shown as black dashed lines with donor and acceptor atoms labeled. Note repositioning of Gln189 and Met49 in particular.

