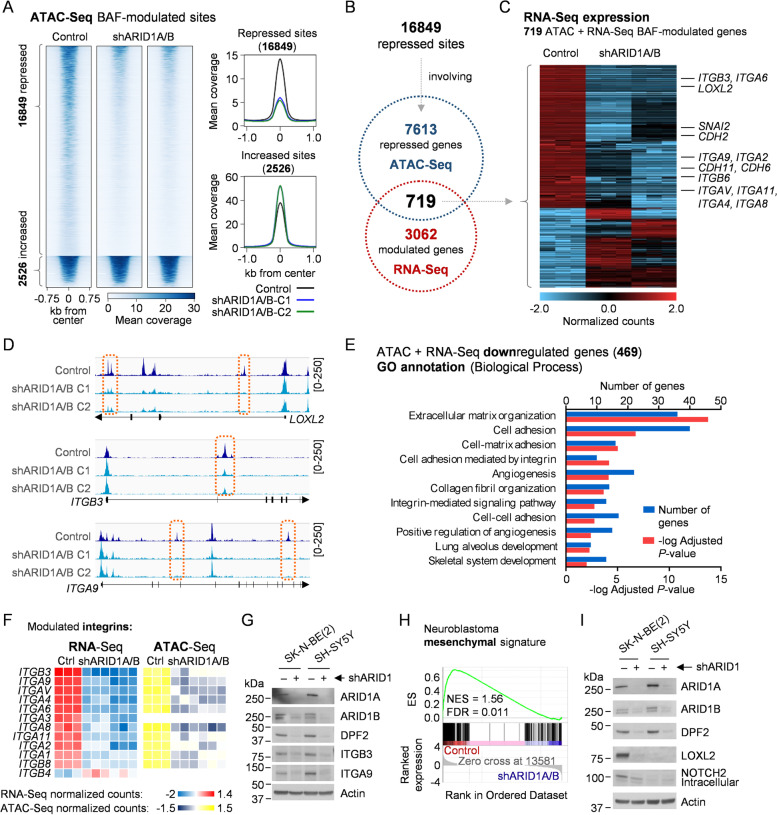
Fig. 3.
Genome-wide repression of chromatin accessibility after BAF disruption involves an invasiveness-related gene expression network. A Heatmap and profile plots of significantly ATAC-Seq modulated peaks (False Discovery Rate < 0.01) after BAF disruption (shARID1A/B) in SK-N-BE(2). Two different combinations of shRNAs against both genes were used. B Comparison of genes annotated to chromatin repressive events by ATAC-Seq with BAF-modulated genes by RNA-Seq (log2 FC > 1 or < -1, adjusted p-value < 0.05). C Heatmap representing relative RNA expression of 719 BAF disruption-modulated genes and associated to ATAC-Seq chromatin accessibility repressive events. D Representative ATAC-Seq coverage images of the genome browser of repressed sites after BAF disruption in the indicated genes also repressed at the mRNA level. E Gene Ontology (GO) Biological Process analysis of 469 ATAC and RNA-Seq repressed genes, showing enriched categories with adjusted p-value < 0.01. F Heatmap representing relative mRNA expression of 11 BAF-modulated integrin genes and the mean normalized ATAC-Seq counts of their observed chromatin accessibility repressive events. G Integrin β3 and α9 western blot analysis in BAF-disrupted cells, at 96 h after co-transduction with shARID1A and shARID1B (shARID1). H Gene Set Enrichment Analysis plot of the neuroblastoma mesenchymal phenotype gene expression signature on control versus shARID1A/B (RNA-Seq). Normalized Enrichment Score (NES) and False Discovery Rate (FDR) are shown. I Western blot validation of the mesenchymal proteins LOXL2 repression after BAF disruption, 96 h post co-transduction with shARID1A and shARID1B (shARID1)

