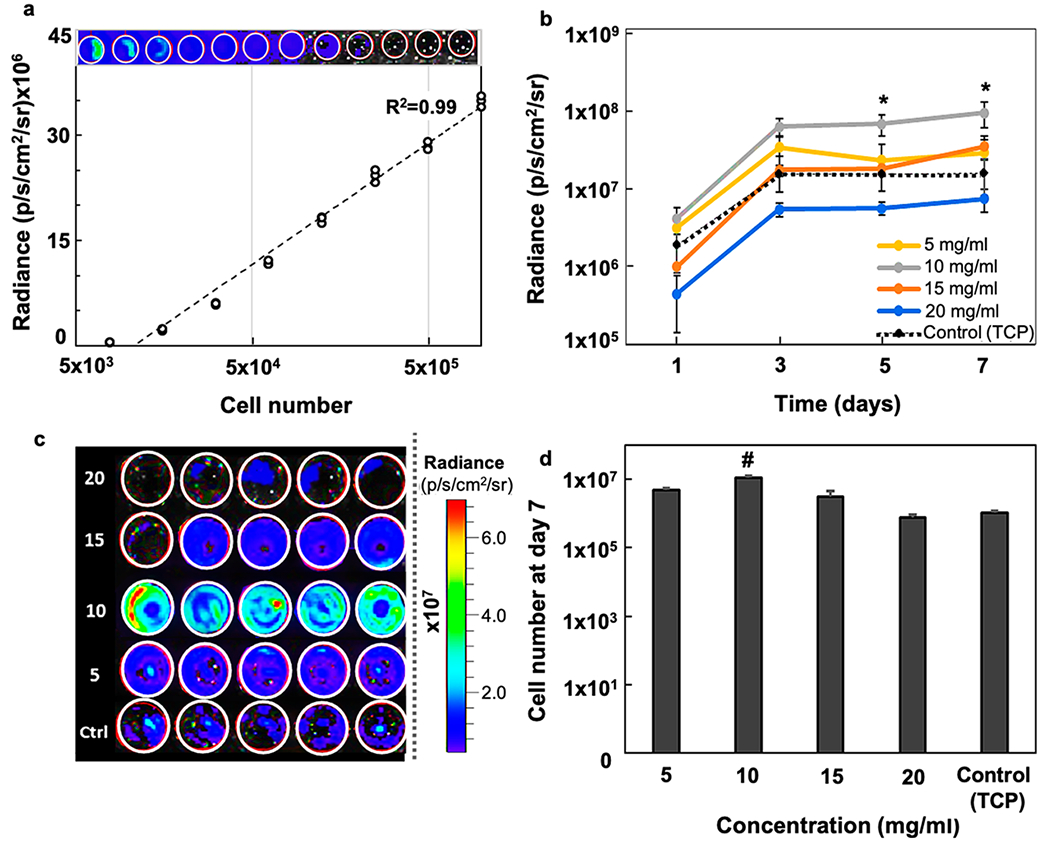
Figure 4.

In vitro BLI. (a) BLI signal intensity vs cell number for naked mGRPs in PBS (R2 = 0.986, n = 3). (b) In vitro BLI signal intensity of hydrogel-scaffolded mGRPs and naked control (n = 4). (c) Representative BLI readout intensity maps at day 7. Values (left) represent different composite hydrogel densities expressed in mg/mL. (d) Comparison of corresponding cells numbers at day 7 as calculated from the BLI intensity plot shown in (a), #p < 0.05 as compared to all groups. *p < 0.05 between compared groups.
