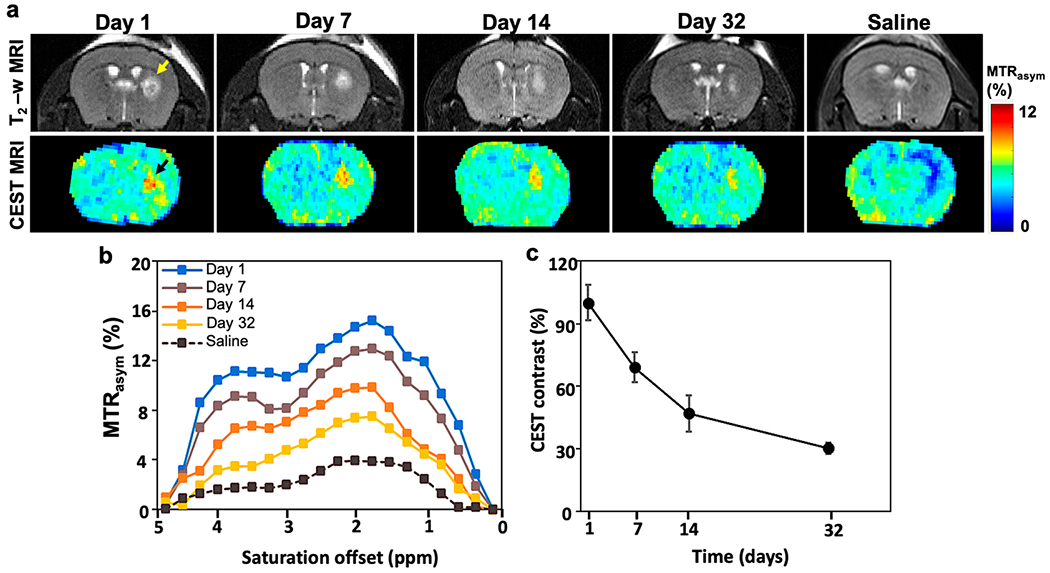
Figure 8.

In vivo T2-w and CEST MRI. (a) T2-w (top) and CEST MR (bottom) maps of immunocompetent BALB/c mouse brain transplanted with either scaffolded or unscaffolded (saline control) mGRPs in the right striatum. Yellow and black arrows indicate a T2 hyperintense region and CEST contrast at the cell transplant region. (b) MTRasym spectra and (c) normalized CEST contrast at 3.6 ppm on the transplant site at different time points until day 32.
