Figure 9.

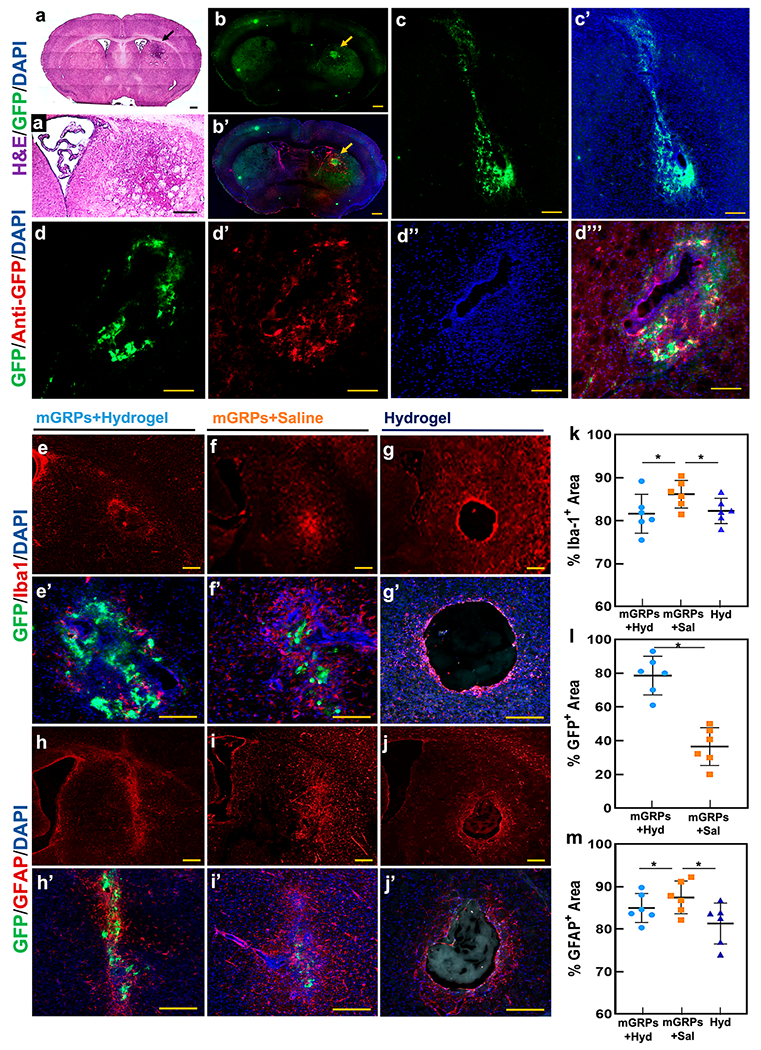
Immunohistological assessment of graft fate. (a,a′) Whole brain and enlarged view of H&E-stained brain sections containing scaffolded GFP+ mGRPs (black arrow) at day 14 post transplantation. (b,b′) Whole brain section containing the GFP+ mGRP + hydrogel transplantation site and overlay of the graft region with anti-Iba-1 and DAPI staining. (c,c′) High magnification view of graft region with GFP+ mGRPs and DAPI overlay. (d–d‴) Anti-GFP and DAPI overlay of GFP+ mGRP graft site. (e–g) Anti-Iba-1 and (h–j) anti-GFAP immunostaining of the graft regions at day 14 for hydrogel-scaffolded mGRPs, naked cells, and hydrogel only. (e′–g′) and (h′–j′) High magnification images of the GFP+ region overlaid on Iba-1+ and GFAP+ regions. (k–m) Quantitative comparison of Iba-1+, GFAP+, and GFP+ regions for hydrogel-scaffolded mGRPs, naked cells, and hydrogel only. *p < 0.05, n = 4. Scale bar = 100 μm.
