

Summary
By their capacity to induce peripheral T cell tolerance, dendritic cells (DCs) present a promising target cell and therapeutic strategy for treatment of several autoimmune diseases including multiple sclerosis (MS). This protocol describes how to determine the tolerogenic capacities of DCs in the context of the murine MS model, experimental autoimmune encephalomyelitis (EAE). We provide a step-by-step instruction for EAE induction, antigen-loaded bone-marrow-derived-DC (BM-DC) generation, adoptive cell transfer, and analysis of DC-mediated changes in regulatory T cell populations.
For complete details on the use and execution of this protocol, please refer to Vogel et al. (2022).
Subject areas: Cell biology, Cell culture, Cell isolation, Flow cytometry/Mass cytometry, Immunology, Model organisms
Graphical abstract
Highlights
-
•
Protocol to induce EAE in mice and score for disease phenotypes
-
•
Generation and adoptive transfer of MOG35-55-loaded BM-DCs
-
•
Protocol to assess the tolerogenic properties of transferred DCs
-
•
Flow cytometric analysis of Tregs in secondary lymphoid organs
Publisher’s note: Undertaking any experimental protocol requires adherence to local institutional guidelines for laboratory safety and ethics.
By their capacity to induce peripheral T cell tolerance, dendritic cells (DCs) present a promising target cell and therapeutic strategy for treatment of several autoimmune diseases including multiple sclerosis (MS). This protocol describes how to determine the tolerogenic capacities of DCs in the context of the murine MS model, experimental autoimmune encephalomyelitis (EAE). We provide a step-by-step instruction for EAE induction, antigen-loaded bone-marrow-derived-DC (BM-DC) generation, adoptive cell transfer, and analysis of DC-mediated changes in regulatory T cell populations.
Before you begin
The protocol below describes the specific steps for the induction of EAE in mice and the subsequent generation and transfer of antigen-loaded tolerogenic BM-DCs. We further provide a practical guide in how to isolate and analyze cells in secondary lymphoid organs upon BM-DC transfer, with a special focus on regulatory T-cells. Although protocols exist for EAE (Croxford et al., 2011), this specific protocol described here, concerns how to assess the in vivo tolerogenic properties of DCs in the context of EAE.
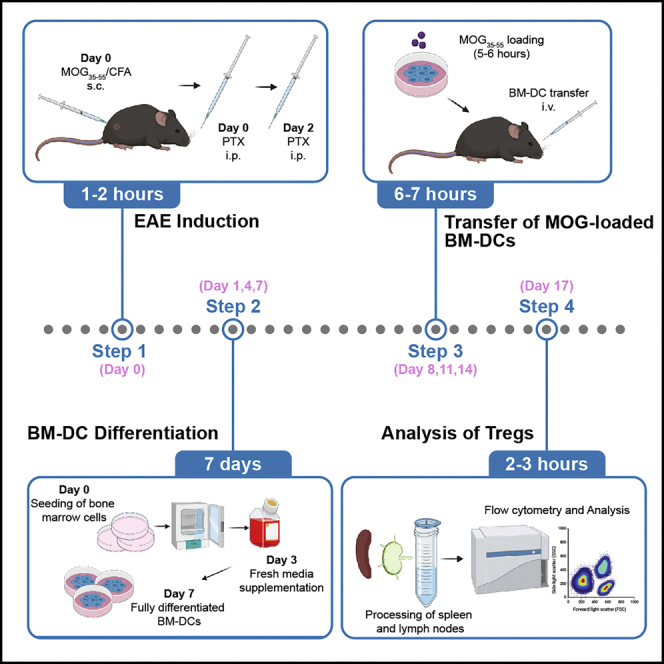
Before starting, we recommend establishing the EAE model in advance and just after that performing the actual BM-DC transfer experiment. This protocol requires a time schedule encompassing matching up time-points for BM-DC differentiation, EAE induction, adoptive transfers, and termination days. We suggest scheduling the different experimental steps according to the following scheme (Figure 1).
Figure 1.

Experimental scheme and timeline of EAE induction, BM-DC differentiation, and adoptive BM-DC transfers
Institutional permissions
Prior to performing this protocol, the described animal studies must be approved by an institutional or national committee. All experimental procedures in this study were approved by the Austrian Ministry of Sciences (BMBWF-66.009/0265-V/3b/2019) and were conducted in strict accordance with Austrian law and FELASA guidelines.
Mice
The MOG35–55 EAE is an established murine disease model for C57BL/6 mice (Croxford et al., 2011). We recommend inducing EAE in 7–10 mice per experimental group, which are 8–12 week old. According to various reports and our own experience, the EAE model exhibits clear sex specific differences. Female mice display increased demyelination and spinal cord infiltrating immune cells while male animals exhibit a stronger pro-inflammatory response of immune cells but also increased frequencies of regulatory cells (Wiedrick et al., 2021). Notably, sex hormones including estrogen are highly protective against EAE and thereby distinct female estrous phases influence EAE development (Rahn et al., 2014; Benedek et al., 2016). We noticed that in our experimental room female mice exhibit increased inter-mouse variance in EAE clinical course due to non-synchronized estrous phases and therefore usually use male animals. We suggest to include animals of both sexes in the set-up experiment to determine which gender shows more consistent EAE development.
Prepare complete Freud’s adjuvants (CFA)
Timing: 5 min
-
1.
Add one vial (100 mg) of Mycobacterium tuberculosis H37Ra into one vial (10 mL) of Incomplete Freund’s adjuvant (IFA).
-
2.
Thoroughly mix by vortexing for 5 s.
-
3.
Store CFA stock at 4°C for further use.
Prepare MOG35–55 injection emulsion
-
4.
Upon arrival of MOG35–55, reconstitute the powder with sterile ddH2O to a stock concentration of 1 mg/mL and freeze aliquots at −20°C. We typically prepare 1 mL and 500 μL aliquots. Store MOG35–55 aliquots at −20°C for up to 1 year.
-
5.
Calculate total volume of injection solution needed (150 μL per mouse) according to table in materials and equipment.
-
6.
Increase calculated volume by at least 30% (needed for dead volume of syringe and loss during needle drawing).
-
7.
Emulsify MOG35–55 and CFA by sonication until the solution turns white and viscous (Figure 2) (We usually do 3 cycles, 10 sec with 70% power).
CRITICAL: During sonication ensure MOG solution does not overheat by keeping it on ice or taking breaks between cycles.
Note: Emulsion cannot be stored and should always be used fresh.
Alternatives: Alternatively, emulsify MOG35–55/CFA with a 20-gauge needle/syringe by aspirating the solution up and down 30–50 times.
-
8.
Draw MOG35–55/CFA emulsion into a 1 mL syringe.
Figure 2.

Preparation of the MOG/CFA emulsion
Prepare pertussis injection solution
-
9.
Upon arrival dissolve lyophilized pertussis toxin in sterile PBS to a stock concentration of 100 μg/mL.
-
10.
Store reconstituted stock solution at 4°C for up to 6 months.
Prepare erythrocyte-lysis buffer
-
11.
Dissolve chemicals in ddH2O as indicated in the Erythrocyte-Lysis buffer table in materials and equipment.
-
12.
Adjust pH to 7.2–7.4 with HCl.
-
13.
Sterile filter solution and store at 4°C in the fridge.
Key resources table
| REAGENT or RESOURCE | SOURCE | IDENTIFIER |
|---|---|---|
| Antibodies | ||
| Anti-mouse CD11c-PC5.5 (Clone N418) | Thermo Fisher Scientific | Cat# 35-0114-82, RRID: AB_469709) |
| Anti-mouse CD45.2-BV650 (Clone 104) | BioLegend | Cat# 109835, RRID: AB_11203374 |
| Anti-mouse CD80-PE (Clone 16-10A1) | BioLegend | Cat# 104707, RRID: AB_313128 |
| Anti-mouse MHC Class II (I-A/I-E)-eF450 (Clone M5/114.15.2) | Thermo Fisher Scientific | Cat# 48-5321-82, RRID: AB_1272204 |
| Anti-mouse CD86-FITC (Clone GL-1) | BioLegend | Cat# 105005, RRID: AB_313148 |
| Anti-mouse CD3e-redFluor710 (Clone 17A2) | Tonbo Biosciences | Cat# 80-0032, RRID: AB_2621971 |
| Anti-mouse CD25-BV421 (Clone PC61) | BioLegend | Cat# 102033, RRID: AB_10895908 |
| Anti-mouse CD8a-BV510 (Clone 53-6.7) | BioLegend | Cat# 100752, RRID: AB_2563057 |
| Anti-mouse CD4-PerCP-Cy5.5 (Clone GK1) | BioLegend | Cat# 100433, RRID: AB_893330 |
| Anti-mouse FoxP3-APC (Clone 3G3) | Tonbo Biosciences | Cat# 20-5773, RRID: AB_2621604 |
| Mouse IgG1 kappa-APC (Clone MOPC-21) | BioLegend | Cat# 981806 |
| Chemicals, peptides, and recombinant proteins | ||
| Myelin oligodendrocyte glycoprotein (MOG)35–55 | Charitè Berlin | NA |
| Incomplete Freund’s adjuvant | Sigma-Aldrich | Cat# F5506 |
| Mycobacterium tuberculosis H37Ra | BD | Cat# 231141 |
| Pertussis toxin | List Biological Laboratories | Cat# 181 |
| recombinant murine GM-CSF | R&D | Cat# 415-ML-050 |
| recombinant murine IL-4 | Miltenyi Biotec | Cat# 130-097-761 |
| Fixable Viability Dye eFluor™ 780 | Thermo Fisher Scientific | Cat# 65-0865-14 |
| FoxP3/Transcription factor staining buffer set | Thermo Fisher Scientific | Cat# 00-5523-00 |
| eBioscience Fixation Buffer | Thermo Fisher Scientific | Cat# 00-8222-49 |
| IMDM, 500 mL | Thermo Fisher Scientific | Cat# 12440061 |
| MEM Non-Essential Amino Acids Solution 10 mM (100×) | Thermo Fisher Scientific | Cat# 11140050 |
| 2-Mercaptoethanol, 50 mM (1000×) | Thermo Fisher Scientific | Cat# 31350010 |
| Experimental models: Organisms/strains | ||
| Mouse:C57BL/6J (8–12 week old, male) | Charles River | RRID: IMSR_JAX:000664 |
| Software | ||
| FlowJo v10 | FlowJo LLC | https://www.flowjo.com |
| CytExpert v2.4 | Beckman Coulter | https://www.beckman.at/flow-cytometry/instruments/cytoflex/software |
| Prism v.9 | GraphPad | https://www.graphpad.com/scientific-software/prism/ |
| Other | ||
| Restrainer (TAILVEINER®) | 2Biological Instruments | Cat# TV 150, small |
| Sonicator BANDELIN SONOPULS | BANDELIN | Cat# BASO_17007 |
| Cytoflex S | Beckman Coulter | Product #C01161 |
Materials and equipment
MOG35–55 injection solution (per mouse)
| Reagent | Stock concentration | Dilution | Amount |
|---|---|---|---|
| MOG35–55 | 1 mg/mL | 1:2 | 75 μL |
| CFA | N/A | 1:2 | 75 μL |
| Total | N/A | N/A | 150 μL |
Store MOG aliquots at −20°C for up to 1 year.
Pertussis injection solution (per mouse)
| Reagent | Stock concentration | Final concentration | Amount |
|---|---|---|---|
| Pertussis | 100 μg/mL | 2 μg/mL | 2 μL |
| PBS | N/A | N/A | 98 μL |
| Total | N/A | N/A | 100 μL |
Store reconstituted pertussis stock solution at 4°C for up to 6 months.
Erythrocyte-lysis buffer
| Reagent | Final concentration | Amount |
|---|---|---|
| NH4Cl | 0.15 M | 8.024 g |
| KHCO3 | 10 mM | 1 g |
| Na2EDTA | 0.1 mM | 37.2 mg |
| Total | N/A | 1,000 mL |
Store at 4°C for up to 1 year.
Alternatives: Alternatively, commercially available red blood cell lysis buffers can be used (eg. eBioscience™ 1× RBC Lysis Buffer, Cat# 00-4333-57).
Culture medium
| Reagent | Stock concentration | Final concentration | Amount |
|---|---|---|---|
| IMDM medium | N/A | N/A | 430 mL |
| Fetal bovine serum (FBS) | N/A | 10% (v/v) | 50 mL |
| Penicillin/Streptomycin | 100× | 1% (v/v) | 5 mL |
| non-essential amino acids | 100× | 1% (v/v) | 5 mL |
| 2-mercaptoethanol | 50 mM | 50 μM | 500 μL |
| Total | N/A | N/A | 500 mL |
Alternatives: Alternatively, DC differentiation can also be performed using RPMI or DMEM as culture medium if necessary.
FACS Antibody Staining mix
| Antibody | Dilution | |
|---|---|---|
| Fixable Viability Dye eFluor™ 780 | 1:2,000 | |
| Quality Control of DCs | CD11c-PC5.5 | 1:80 |
| CD45.2-BV650 | 1:100 | |
| CD80-PE | 1:80 | |
| MHC Class II (I-A/I-E)-eF450 | 1:100 | |
| CD86-FITC | 1:80 | |
| T cells | Surface staining | |
| CD3e-redFluor710 | 1:100 | |
| CD25-BV421 | 1:100 | |
| CD8a-BV510 | 1:100 | |
| CD4-PerCP-Cy5.5 | 1:100 | |
| Intracellular staining | ||
| FoxP3-APC | 1:160 | |
| IgG1 kappa-APC (FoxP3 isotype control) | 1:160 | |
Note: If different antibodies are used, determine the appropriate concentration of antibodies by titration and set up the panel and compensation matrix prior to the experiment.
Step-by-step method details
Induction of experimental autoimmune encephalomyelitis (EAE)
-
1.Induction of EAE.
-
a.Prepare MOG injection solution and pertussis injection solution as described earlier.
-
b.Restrain mouse in restrainer.
-
c.Locate the right flank and apply 70% ethanol with a pipet tip to wet the fur and localize the injection site (see Methods video S1).Methods video S1. Subcutaneous injection of MOG/CFA emulsion for EAE induction, related to step 1Download video file (30.1MB, mp4)
-
d.Subcutaneously inject mouse with 75 μL of MOG-emulsion and carefully remove the needle (see Methods video S1).
-
e.Repeat at left flank.CRITICAL: Successful subcutaneous injections should result in visible bolus shaped depots under the skin. No significant amount of MOG/CFA emulsion should leak after the injection.
-
f.Draw pertussis injection solution in a 1 mL syringe.
-
g.Inject each mouse i.p. with 100 μL.
-
h.2 days later repeat the preparation and injection of the pertussis solution.
-
a.
-
2.EAE scoring.
-
a.Starting on day 7 post EAE induction, examine mice daily for weight loss and clinical symptoms.
-
b.Classify clinical symptoms according to the following criteria. See Methods video S2.
-
a.
EAE scoring table
| Score | Clinical symptoms, observations |
|---|---|
| 0 | No clinical symptoms, mouse is healthy. |
| 0.5 | Slight orientation or motoric problems during climbing. The tail shows muscle tension, but tip of the tail is limp. |
| 1 | Complete paralysis of the tail. When the mouse is picked up, the whole tail is loosely hanging down with no muscle tension. |
| 1.5 | Complete paralysis of the tail and first signs of hind leg weakness by wobbly motions. |
| 2 | Paralysis of one hind leg. |
| 2.5 | Paralysis of one hind leg and restrained movement of the second hind leg. |
| 3 | Paralysis of both hind legs. |
| 3.5 | Paralysis of both hind legs and restrained movement in one of the front legs. |
| 4 | Complete hind and advanced front leg paralysis. The mouse cannot move around the cage at all and does not respond to contact. Mice should be euthanized at this score and a score of 4 is entered for the rest of the experiment. Mice that are found dead in the cage also get a score of 4 for the rest of the experiment. |
Note: The disease kinetics (day of onset, peak, remission phase varies between experiments, mouse strains, laboratories. However, a successful immunization regimen should result in 80%–100% disease incidence. Typically, mice start to lose weight and develop the first symptoms within 7–12 days after EAE induction (Mendel et al., 1995; Barthelmes et al., 2016). Troubleshooting 1.
Note: Some mice may develop skin lesions at the injection site. Small ulcers usually heal within a few days without treatment but if necessary, mice can be treated with antibiotic ointment. However, in rare cases some mice develop larger skin lesions (approximately 2 cm diameter) which are characterized by complete hair loss and redness. Mice with this type of lesion rarely develop EAE symptoms and should be excluded from the experiment.
Bone marrow isolation and differentiation of bone-marrow-derived dendritic cells (BM-DCs)
-
3.Isolation of bones.
-
a.Humanely euthanize mice according to ethical guidelines and spray with 70% ethanol to sterilize skin.Note: We usually use 8–12 week old mice for BM-DC generation.
-
b.Cut open abdominal skin with scissors and remove skin from the whole hind leg by pulling out the leg from its skin layers.
-
c.Dislocate the hip joint without breaking it, remove the whole hind-leg and place it in a falcon with fresh PBS.CRITICAL: Bones should not get broken during the isolation otherwise bone marrow cells might get contaminated.
-
a.
-
4.
Perform all following steps in a tissue culture-hood.
-
5.Isolation of bone marrow cells (Figure 3).
-
a.Take hind legs out of tube and quickly dip in a falcon filled with 70% ethanol. Place bones on a sterile paper towel.
-
b.Remove the paw and subsequently try to remove as much muscle and connective tissue as possible.
-
c.Place the bones in a 6-well dish filled with sterile PBS (finish bone isolation of all mice/genotypes needed for the experiment).
-
d.Prepare 50 mL falcons and place a 70 μM cell strainer on them.
-
e.Pre-wet strainer with 2 mL of PBS.
-
f.Take the tibia and femur with a sterile forceps and trim both ends using sterilized scissors to open up the bones.
-
g.Take a 5 mL syringe and fill it with 5 mL sterile PBS and attach a 27-gauge needle to it.
-
h.Hold the tibia/femur over the prepared strainer, insert the needle into the narrow end of the tibia/femur.
-
i.Flush the bone marrow onto the 70 μM strainer.
-
j.Carefully disrupt bone marrow chunks with the tip of the serological pipet and wash the strainer with 10 mL PBS or culture medium.
-
k.When no more red chunks are visible on the strainer, spin down cell suspension at 500 g for 5 min at room temperature.
-
l.A clear red visible pellet should be visible.
-
m.Discard the supernatant by inverting the falcon over a waste bottle.
-
n.Resuspend cell pellet in 1 mL of erythrocyte-lysis buffer, incubate for 5 min at room temperature.
-
o.Stop erythrocyte-lysis by adding 10 mL of culture medium.
-
p.Spin down cell suspension at 500 g for 5 min at room temperature. Pellet should be completely white. In case pellet remains red, erylysis should be repeated.
-
q.Discard the supernatant by inverting the falcon over a waste bottle.
-
r.Resuspend cell pellet in 10 mL of culture medium and count cells.
-
a.
-
6.Start BM-DC differentiation.
-
a.Seed 5 × 10⁶ cells in 10 mL culture medium in a 10 cm tissue-culture treated petri-dish with 20 ng/mL GM-CSF and 5 ng/mL IL-4.
-
b.Put dishes in a 37°C, 5% CO2 incubator.
-
a.
-
7.
Day 3: Add 5 mL of fresh culture media with 20 ng/mL GM-CSF and 5 ng/mL IL-4. Total volume of culture media is then 15 mL.
Optional: BM-DC generation also works from frozen bone-marrow, however in our experience the yield of fully-differentiated BM-DCs is decreased.
Figure 3.

Critical steps of bone marrow isolation and BM-DC differentiation
Harvest of fully differentiated BM-DCs and antigen loading
-
8.Day 6–7: Harvest fully differentiated BM-DCs (troubleshooting 2).
-
a.Check cell morphology and confluency under the microscope (Figure 4A).
-
b.Carefully remove 6 mL of media directly from surface.
-
c.With the remaining media detach loosely attached cells by pipetting over the dish several times.CRITICAL: Post differentiation, do not use highly adherent cells as most of these cells do not represent mature BM-DCs (Helft et al., 2015).
-
d.Transfer cell suspension in a 15 mL falcon and count cells.
-
a.
-
9.Antigen loading of BM-DCs.
-
a.Spin down cell suspension at 500 g for 5 min at room temperature and discard the supernatant.
-
b.Resuspend 2 × 10⁶ cells in 2 mL culture medium per well and plate in a 6 well plate.
-
c.Immediately add 10 μg/mL MOG35–55 (freshly thawed aliquot).Note: Always plate a little more BM-DCs than needed. Not all cells can be recovered after scraping and additional suspension is needed for the dead volume of the syringe and BM-DC quality control.
-
d.Incubate cells for 5–6 h in a 37°C, 5%CO2 incubator.
-
a.
Figure 4.

Quality control of antigen-loaded BM-DCs
(A and B) Morphology of BM-DC cultures during differentiation (A) and quality control of MOG35–55 loaded BM-DCs by flow cytometry (B). Scale bars = 500 μM, cells are gated for viable CD11c+ DCs and further assessed for their CD80, CD86, MHC-II, and MHC-I surface expression.
Transfer of antigen-loaded DCs and quality control
This step describes adoptive transfer of antigen loaded bone-marrow derived dendritic cells and their quality control. The quantity of cell transfers and the exact timing might be adapted depending on the biological question.
-
10.Harvest of MOG-loaded BM-DCs.
-
a.Visually check cells (upon antigen loading DCs usually loosely attach to the dish) under the microscope.
-
b.Gently detach DCs by using a cell scraper.
-
c.Transfer cell suspension into a 15 mL falcon.
-
d.Determine cell number.
-
e.Spin down cell suspension at 500 g for 5 min at room temperature and discard the supernatant.
-
f.Resuspend cells in sterile PBS at a concentration of 1 × 10⁷ cells/mL. You will require 50 μL per mouse plus 100 μL excess volume if syringes with dead-volume are used.
-
g.Transfer cell suspension in an Eppendorf tube (2 mL or 5 mL) and store cells on ice until injections. Injections should be performed immediately.
-
h.Keep a cell aliquot for the quality control (step 12).
-
a.
-
11.Transfer of cells.
-
a.Randomize mice across experimental groups/conditions.
-
b.Anaesthetize mice with isoflurane (2%–4% under constant oxygen flow).
-
c.Draw BM-DC cell suspension into a 1 mL syringe and mount a 27G needle.
-
d.Intravenously inject each mouse with 50 μL of the DC cell suspension via the retro-orbital sinusoid.
-
a.
Note: The BM-DC transfer is also compatible with the use of in vivo blocking antibodies such as anti-PD-1. We usually inject blocking antibodies i.p. 2–4 h before mice receive the cell transfer. For further details please refer to (Vogel et al., 2022).
-
12.Quality control of transferred BM-DCs.
-
a.Transfer approximately 0.5 × 10⁶ cells in a 96-well plate for staining. Alternatively, cells can also be stained in a tube.
-
b.Prepare the DC quality control antibody staining mix (according to table in materials and equipment) in 1% FCS/PBS (including viability dye).
-
c.Centrifuge cells at 500 g for 5 min at room temperature and discard the supernatant.
-
d.Resuspend cells in 10 μL staining mix and incubate for 15 min at RT.
-
e.Add 180 μL of 1% FCS/PBS and centrifuge at 500 g for 5 min at RT.
-
f.Discard the supernatant and resuspend pellets in 150 μL 1% FCS/PBS.
 Pause point: If cells cannot be analyzed on the same day, resuspend cells in 100 μL eBioscience fixation buffer and incubate for 15 min at RT. Spin cells at 500 g for 5 min at room temperature, discard the supernatant and resuspend in 150 μL 1% FCS/PBS. Cells can now be stored at 4°C in the dark for several days.
 -
g.Acquire samples on FACS machine.
-
a.
Harvest and processing of spleen and lymph nodes
-
13.3 days after the last DC-transfer (day 17 post EAE induction), euthanize mice and process spleen and lymph nodes for flow cytometric analysis.
-
a.Prepare a 6-well plate, place a 70 μm strainer in each well and fill with 3 mL of sterile PBS. Put plate on ice.
-
b.Isolate spleen and inguinal lymph nodes of each mouse and place into a separate well.
-
a.
-
14.Spleen processing.
-
a.By using the plunger from a 5 mL syringe, mash the spleen through the cell strainer.
-
b.Wash the strainer with 5 mL of PBS.
-
c.Discard the strainer.
-
d.Transfer splenocyte cell suspension into a 15 mL falcon.
-
e.Centrifuge cells at 500 g for 5 min at RT.
-
f.Decant the supernatant and resuspend pellet in 1 mL of erythrocyte-lysis buffer.
-
g.Incubate for 5 min at RT.
-
h.Fill up falcon to 10 mL with PBS and spin down cells at 500 g for 5 min at RT.
-
i.Decant supernatant and resuspend pellet in 10 mL PBS.CRITICAL: Remove cell clumps that usually form during erythrocyte-lysis.
-
j.Transfer 200 μL splenocyte suspension into a 96-well plate and continue with “flow cytometry staining”.
-
a.
-
15.Lymph node processing.
-
a.By using the plunger from a 5 mL syringe, mash the lymph nodes through the cell strainer.
-
b.Wash the strainer with 5 mL of PBS.
-
c.Discard the strainer.
-
d.Transfer cell suspension into a 15 mL falcon.
-
e.Centrifuge cells at 500 g for 5 min at RT.
-
f.Decant supernatant and resuspend pellet in 5 mL PBS.
-
g.Transfer 200 μL lymph node suspension into a 96-well plate and continue with “flow cytometry staining”.
-
a.
Flow cytometry staining
-
16.
Prepare antibody staining mix (according to table in materials and equipment) in 1% FCS/PBS (including viability dye).
Note: Include single staining controls for setting up a proper compensation. For critical surface markers, exhibiting gradual expression patterns such as CD25, include fluorescence minus one (FMO) controls to ensure proper gating during data analysis.
-
17.
Centrifuge 96-well plates with spleen and lymph node cells at 500 g for 5 min at RT and discard supernatant.
-
18.
Resuspend cells in 10 μL antibody staining mix and incubate for 15 min at RT in the dark.
-
19.
Wash cells by adding 180 μL 1% FCS/PBS to each well.
-
20.
Centrifuge plate at 500 g for 5 min at RT and discard supernatant.
-
21.
Prepare 1× Fix/Perm buffer by adding 1 part Fix/Perm concentrate and 3 parts Fix/Perm Diluent from the FoxP3 Fix/Perm Buffer Kit (see key resources table).
-
22.
Resuspend pellets in 80 μL Fix/Perm buffer and incubate for 30 min at RT in the dark.
-
23.
Prepare 1× Perm buffer by diluting 1 part 10× Perm buffer from the FoxP3 Fix/Perm Buffer Kit (see key resources table) in 9 parts ddH2O.
-
24.
Wash cells by adding 100 μL 1× Perm buffer to each well.
-
25.
Centrifuge plate at 500 g for 5 min at RT and discard supernatant.
Note: Cells are hardly visible after fixation.
-
26.
Resuspend cells in 150 μL 1× Perm buffer and incubate for 5 min at RT in the dark.
-
27.
Centrifuge plate at 500 g for 5 min at RT and discard supernatant.
-
28.
Prepare the intracellular antibody staining mix (according to table in materials and equipment) in 1× Perm Buffer.
-
29.
Resuspend cells in 10 μL intracellular antibody staining mix and incubate for 30 min at RT in the dark.
Note: For staining of nuclear antigens such as FoxP3, always include an isotype control.
-
30.
Wash cells by adding 150 μL 1× Perm buffer.
-
31.
Centrifuge plate at 500 g for 5 min at RT and discard supernatant.
-
32.
Resuspend cells in 150 μL 1% FCS/PBS.
-
33.Acquire samples on FACS machine.
-
a.We used a Cytoflex S flow cytometer (Beckman Coulter) for our studies and analyzed the data using CytExpert and FlowJo.
-
a.
Expected outcomes
Fully differentiated, MOG35–55 loaded BM-DCs should be viable and exhibit clear baseline CD80, CD86, MHCII, MHCI surface expression (Figure 4). Additionally, quality control of DCs can be extended to fully characterize the expression patterns of co-inhibitory vs. co-stimulatory receptors of the transferred DCs. These markers can include but are not limited to PD-L1, PD-L2, CD85k, Gal9 or HVME (Vogel et al., 2022).
As shown in Figure 5A, repeated adoptive transfer of MOG35–55 loaded DCs strongly ameliorates EAE severity as assessed by the course of clinical scores and weight loss. The improvement of EAE severity is accompanied by a significant increase in regulatory CD4+CD25+FoxP3+ Tregs in the inguinal lymph node and spleen at 17 days post EAE induction (Figure 5B). We also observed that the tolerogenic properties of DCs and their potential to induce Tregs can already be assessed 3 days after a single BM-DC transfer on day 7 post EAE induction (Vogel et al., 2022).
Figure 5.

BM-DC transfer ameliorates EAE and induces Tregs
Clinical scores, weights, cumulative and maximum score of EAE-bearing mice after no DC transfer or the transfer of 500 000 MOG loaded BM-DCs (A) and quantification of Tregs in spleen and lymph nodes 3 days after the last DC transfer (day 17). n = 5–6 per group (B). Data are represented as mean ± SEM of biologically independent animals. ∗P < 0.05, ∗∗∗P < 0.001, unpaired t-test.
Quantification and statistical analysis
Differences in clinical EAE scores and weight loss over the disease course serve as a main read-out for the tolerogenic potential of transferred DCs (Figure 5A). Additionally, parameters such as cumulative score (summarizing each daily score to a total cumulative score), maximum disease score reached (Figure 5A), or the day of onset/peak can be used to assess differences in disease kinetic or severity.
For the analysis of Treg populations in the spleen and lymph nodes, a gating strategy as shown in Figure 6 can be used. Flow cytometric gates for CD25+FoxP3+CD4+ T cells should be set based on FMO and isotype controls (Figure 7). Quantification of Tregs as percentage of CD4+ or all CD3+ T cells allows the comparison of DC-mediated Treg induction between the experimental groups.
Figure 6.

Flow cytometric analysis of splenic Tregs in the spleen 3 days after the last DC transfer
Figure 7.

Gating of CD25+ T cells and FoxP3+ CD4+ T cells based on a FMO and isotype control
Limitations
Many variables including mouse gender, age, housing conditions (diet, temperature, microbiota), stress and pertussis potency/dosing strongly affect EAE onset and severity. Transferred BM-DC numbers, timing and quantity of adoptive cell transfers described in this protocol have been optimized for the EAE kinetics established in our laboratory and might need to be adapted.
This protocol specifically focuses on the analysis and quantification of Tregs in response to the transfer of antigen loaded DCs. However, many other tolerogenic features of DCs such as cytokine production can account for observed effects and require additional read-outs.
Troubleshooting
Problem 1
Mice do not develop EAE or just show very low disease scores. (See step 2).
Potential solution
-
•
Increase dose of pertussis. Every new pertussis batch needs to be tested for its potency.
-
•
Stress significantly reduces EAE incidence and severity. Try to minimize stress of the animals as much as possible especially during the immunization period. If mice are moved to other rooms, let them rest for at least a week prior to EAE induction.
-
•
Always freshly prepare pertussis injection solution.
-
•
Only use freshly thawed MOG35–55 aliquots and keep always on ice.
-
•
Ensure proper injection technique. Failed s.c. and i.p. injections strongly interfere with EAE development.
Problem 2
Bone marrow cells are not properly differentiated into DCs. (See step 8).
Potential solution
-
•
Assess the potency of GM-CSF and IL-4 by increasing their concentration. Avoid repeated freeze-thaw cycles of cytokines.
-
•
Test a different FCS batch.
-
•
Increase the number of seeded bone marrow cells at the start of differentiation to 1 × 10⁷ in 10 mL.
Problem 3
BM-DC Transfer does not ameliorate EAE severity. (See steps 11 and 12).
Potential solution
-
•
Check viability and expression of quality control markers of BM-DCs after MOG35–55 loading.
-
•
Increase MOG35–55 concentration.
-
•
Increase BM-DC numbers transferred.
-
•
Depending on EAE onset and severity, timepoints of BM-DC transfers can be changed.
-
•
Ensure proper intravenous injection technique.
Problem 4
BM-DC transfer does not increase abundance of CD25+FoxP3+CD4+ T cell population.
Potential solution
We noticed that the appropriate timepoint of harvest and the location (spleen or lymph node) are critical to observe the described effect.
Problem 5
Problems with flow cytometric analysis and/or proper gating of T cell populations and Tregs.
Potential solution
-
•
Titrate correct dilution of antibody to get the best signal resolution.
-
•
Check if compensation is correct.
-
•
If isotype or FMO controls exhibit signal and thereby indicate high unspecific binding, increase washing steps after antibody staining or add an additional Fc blocking step (e.g., with TruStain FcX™, BioLegend, Cat# 101319) prior to the surface staining.
Resource availability
Lead contact
Further information and requests for resources and reagents should be directed to and will be fulfilled by the lead contact, Omar Sharif (omar.sharif@meduniwien.ac.at).
Materials availability
This study did not generate new unique reagents.
Acknowledgments
The graphical abstract and Figure 1 were created by using BioRender.com. This work was supported by the FWF 31106 (to G.S.) and 31568 (to O.S.), the Christian Doppler Laboratory for Arginine Metabolism in Rheumatoid Arthritis and Multiple Sclerosis (to G.S.), and a DOC fellowship of the Austrian Academy of Sciences (to A.V.).
Author contributions
Methodology: A.V..; data acquisition and analysis: A.V.; writing: A.V. and O.S.; figure and video generation: A.V. and M.K.; funding and supervision: G.S. and O.S. All authors reviewed, edited, and approved the final manuscript.
Declaration of interests
The authors declare no competing interests.
Footnotes
Supplemental information can be found online at https://doi.org/10.1016/j.xpro.2022.101653.
Contributor Information
Andrea Vogel, Email: andrea.vogel@meduniwien.ac.at.
Gernot Schabbauer, Email: gernot.schabbauer@meduniwien.ac.at.
Omar Sharif, Email: omar.sharif@meduniwien.ac.at.
Data and code availability
This study did not generate/analyze any datasets or code.
References
- Barthelmes J., Tafferner N., Kurz J., De Bruin N., Parnham M.J., Geisslinger G., Schiffmann S. Induction of experimental autoimmune encephalomyelitis in mice and evaluation of the disease-dependent distribution of immune cells in various tissues. J. Vis. Exp. 2016:53933. doi: 10.3791/53933. [DOI] [PMC free article] [PubMed] [Google Scholar]
- Benedek G., Zhang J., Bodhankar S., Nguyen H., Kent G., Jordan K., Manning D., Vandenbark A.A., Offner H. Estrogen induces multiple regulatory B cell subtypes and promotes M2 microglia and neuroprotection during experimental autoimmune encephalomyelitis. J. Neuroimmunol. 2016;293:45–53. doi: 10.1016/j.jneuroim.2016.02.009. [DOI] [PMC free article] [PubMed] [Google Scholar]
- Croxford A.L., Kurschus F.C., Waisman A. Mouse models for multiple sclerosis: historical facts and future implications. Biochim. Biophys. Acta. 2011;1812:177–183. doi: 10.1016/j.bbadis.2010.06.010. [DOI] [PubMed] [Google Scholar]
- Helft J., Böttcher J., Chakravarty P., Zelenay S., Huotari J., Schraml B.U., Goubau D., Reis E Sousa C. GM-CSF mouse bone marrow cultures comprise a heterogeneous population of CD11c(+)MHCII(+) macrophages and dendritic cells. Immunity. 2015;42:1197–1211. doi: 10.1016/j.immuni.2015.05.018. [DOI] [PubMed] [Google Scholar]
- Mendel I., Kerlero De Rosbo N., Ben-Nun A. A myelin oligodendrocyte glycoprotein peptide induces typical chronic experimental autoimmune encephalomyelitis in H-2b mice: fine specificity and T cell receptor V beta expression of encephalitogenic T cells. Eur. J. Immunol. 1995;25:1951–1959. doi: 10.1002/eji.1830250723. [DOI] [PubMed] [Google Scholar]
- Rahn E.J., Iannitti T., Donahue R.R., Taylor B.K. Sex differences in a mouse model of multiple sclerosis: neuropathic pain behavior in females but not males and protection from neurological deficits during proestrus. Biol. Sex Differ. 2014;5:4. doi: 10.1186/2042-6410-5-4. [DOI] [PMC free article] [PubMed] [Google Scholar]
- Vogel A., Martin K., Soukup K., Halfmann A., Kerndl M., Brunner J.S., Hofmann M., Oberbichler L., Korosec A., Kuttke M., et al. JAK1 signaling in dendritic cells promotes peripheral tolerance in autoimmunity through PD-L1-mediated regulatory T cell induction. Cell Rep. 2022;38:110420. doi: 10.1016/j.celrep.2022.110420. [DOI] [PubMed] [Google Scholar]
- Wiedrick J., Meza-Romero R., Gerstner G., Seifert H., Chaudhary P., Headrick A., Kent G., Maestas A., Offner H., Vandenbark A.A. Sex differences in EAE reveal common and distinct cellular and molecular components. Cell. Immunol. 2021;359:104242. doi: 10.1016/j.cellimm.2020.104242. [DOI] [PMC free article] [PubMed] [Google Scholar]
Associated Data
This section collects any data citations, data availability statements, or supplementary materials included in this article.
Supplementary Materials
Data Availability Statement
This study did not generate/analyze any datasets or code.