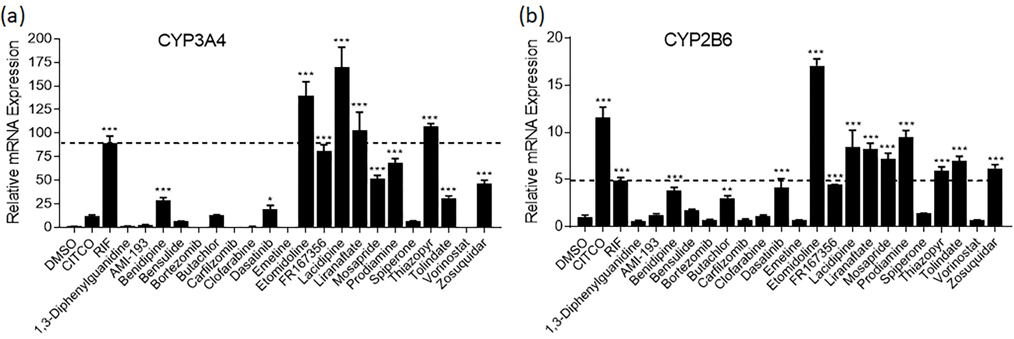
Fig. 2.
mRNA induction in HepaRG cells of CYP3A4 and CYP2B6. HepaRG cells were treated with potential PXR agonists selected from the primary screen, CITCO (1 μM), RIF (10 μM), or the vehicle control (0.1% DMSO) as described in Materials and Methods. Real-time PCR was used to analyze the mRNA expression of CYP3A4 (a) and CYP2B6 (b). The dotted line represents 100% activity of RIF for each graph. Each bar represents the mean ± SD in triplicate. *, p < .05; **, p < .01; ***, p < .001.

