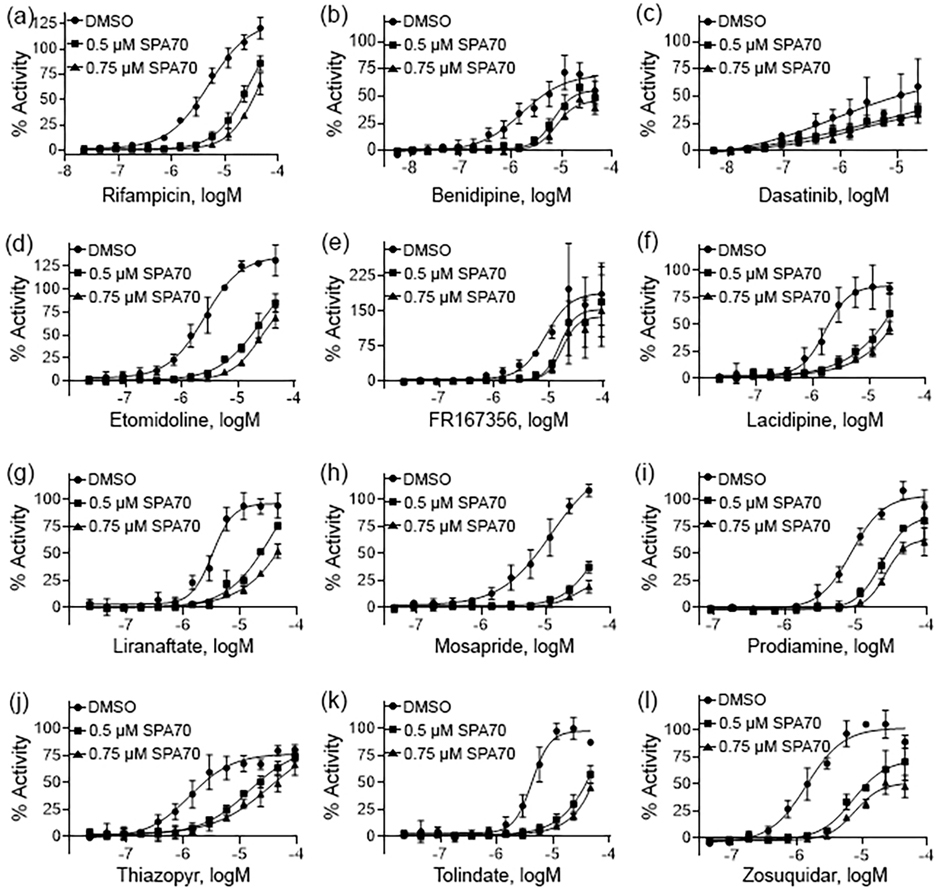
Fig. 3.
Pharmacological concentration response curves of potential PXR agonists. The hPXR-Luc HepG2 stable cells were treated with multiple concentrations of RIF (a), benidipine (b), dasatanib (c), etomidoline (d), FR167356 (e), lacidipine (f), liranaftate, (g), mosapride (h), prodiamine (i), thiazopyr (j), tolindate (k), and zosuquidar (l) and co-treated with DMSO, 0.5 μM SPA70, or 0.75 μM SPA70. The efficacy of each compound was compared to the positive control, RIF (100% = RIF activity). Each curve represents the mean ± SD of three separate experiments.

