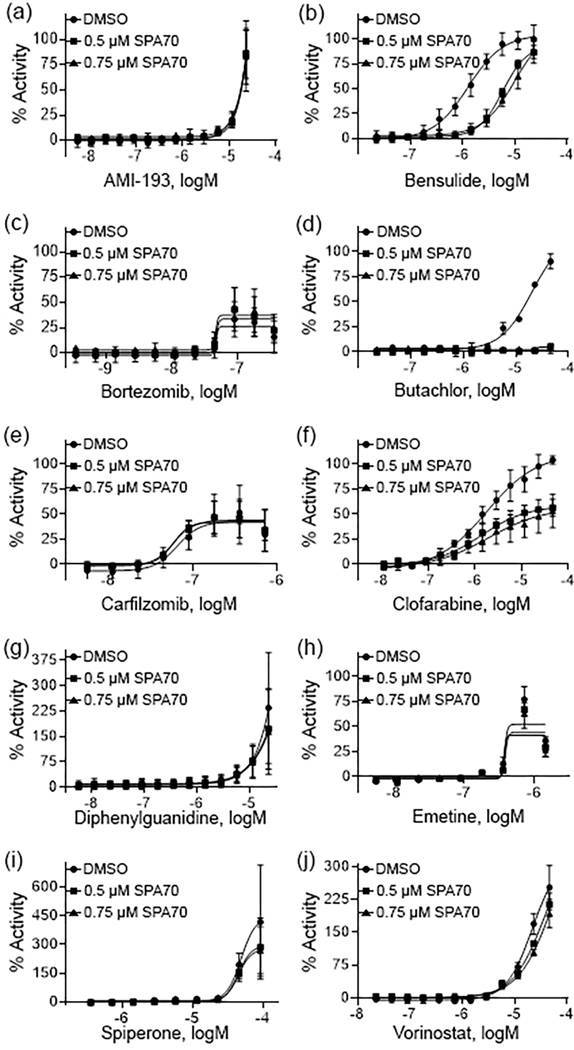
Fig. 4.
Pharmacological concentration response curves of HepaRG PXR inactives. Concentration response curves were acquired on the 10 compounds (a – j) which did not induce CYP3A4 mRNA in HepaRG cells. Each curve was co-treated with DMSO, 0.5 μM SPA70, and 0.75 μM SPA70 to determine pharmacological activity. All data were compared to the positive control, RIF (100% = RIF activity). Data were expressed as mean ± SD from triplicate experiments.

