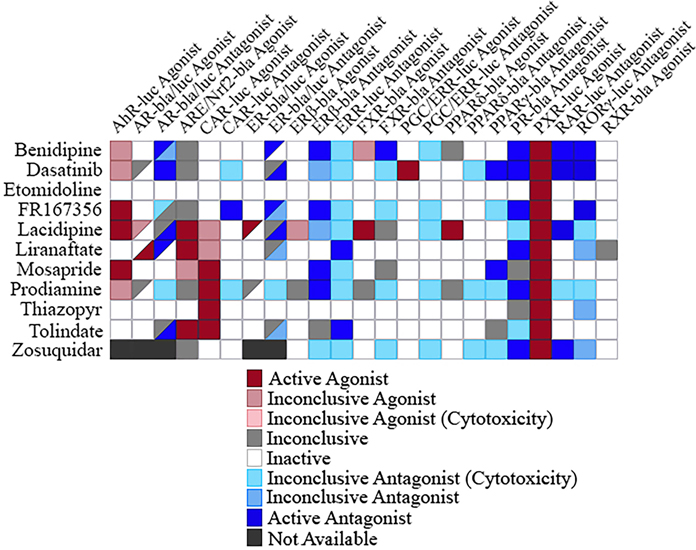
Fig. 6.
Selectivity heatmap of potential PXR agonists. The 11 potential PXR agonists were screened, and their activity outcome in 10 agonist assays and 12 antagonist assays are displayed. For the AR-bla/luc and ER-bla/luc agonist and antagonist assays, the upper left triangle represents the first mentioned assay, while the lower right triangle represents the second assay mentioned.

